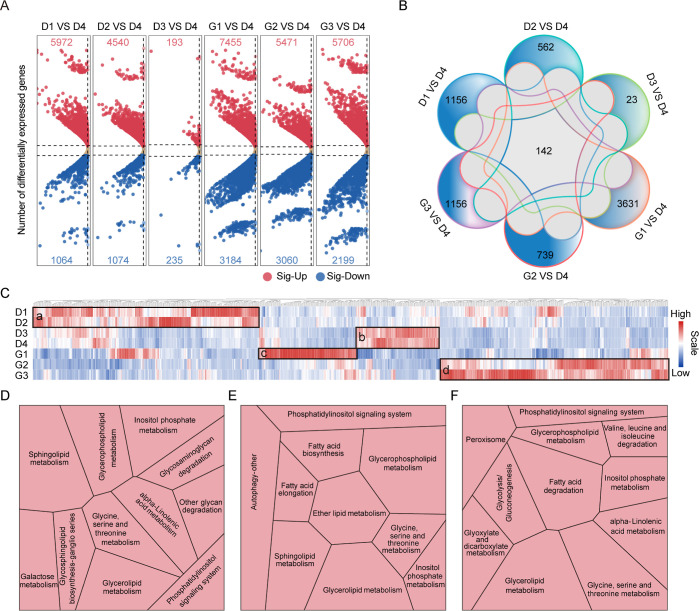
Figure 3.
Transcriptomics sequencing analysis of large-seed peanuts during seed development and germination. (A) Expression levels of differentially expressed genes (DEGs) in each comparison group (seed development stages D1–D3 and germination stages G1–G3 compared to D4). (B) Unique and shared DEGs between comparison groups. (C) Expression levels of DEGs involved in lipid metabolism pathways. DEGs with high expression in early seed development, late seed development, early germination, and late germination are indicated with the letters a, b, c, and d. (D) KEGG pathways involved by DEGs in early development. (E) KEGG pathways involved by DEGs in early germination. (F) KEGG pathways involved by DEGs in late germination. Modules represent metabolic pathways, and the size of the modules represents the proportion of DEGs.

