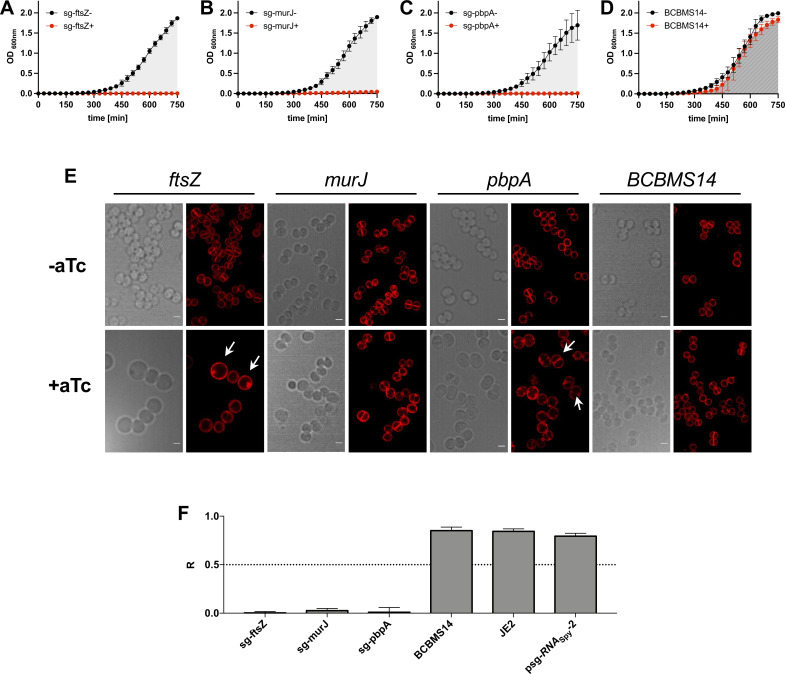
Fig 4.
CRISPRi system with chromosome-encoded dCas9Spy is suitable to target essential genes in S. aureus. (A–D) Growth assays performed in 96-well plates at 30°C in tryptic soy broth (TSB), in the absence (−) or the presence (+) of aTc (200 ng/mL, inducer for dCas9 expression) of BCBMS14 strains expressing sgRNAs targeting the essential genes ftsZ (BCBMS16, A), murJ (BCBMS18, B), and pbpA (BCBMS17, C). The strain BCBMS14 (D) was used as a control. Cells were grown for 120 min (not shown) before being diluted 1:100 into fresh media with the same composition (growth curves shown). (E) Bright-field and fluorescence microscopy images of cells stained with Nile Red (membrane stain) are shown for each strain shown in panels A–D. Scale bars, 1 µm. Overnight cultures were diluted 1/1,000 in fresh TSB and grown at 37°C until OD600 0.6–0.8 for microscopy analysis. Notice that due to the absence of a second dilution to fully deplete essential proteins of interest, strains are able to initiate growth, allowing imaging of the cells during depletion of the protein of interest. Depletion of FtsZ results in greatly enlarged cells (white arrows), MurJ depletion leads to an increase in cell size, and PBP1 depletion leads to cells that are enlarged, elongated and show an invagination (white arrows). (F) Graphs show the ratio (R) of the area under the curve (AUC) of growth curves obtained in the presence (+) versus the absence (−) of aTc for strains shown in panels A–D, as well as for parental strain JE2 and for BCBMS14 containing psg-RNASpy lacking a specific sgRNA sequence. R can vary between 0 (complete growth inhibition in the presence of the inducer) and 1 (no growth inhibition). Error bars indicate the SEM calculated with data from three independent experiments.

