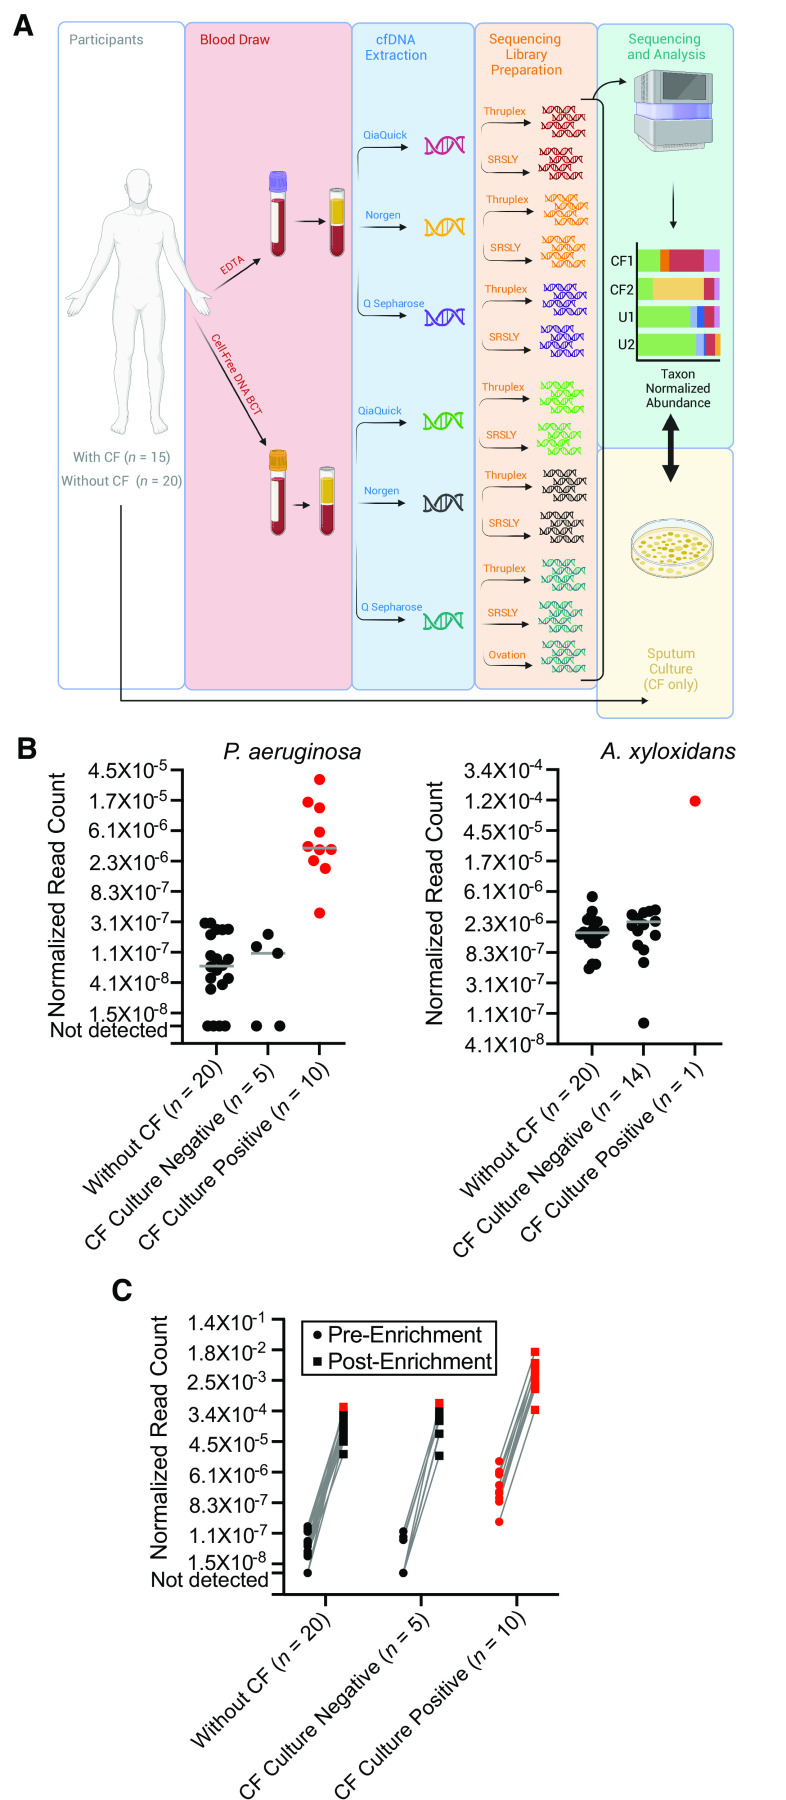
Figure 1.
(A) Schematic illustration of the study design. Whole blood was collected from participants with cystic fibrosis (CF) and healthy, unaffected individuals using two different methods (standard ethylenediaminetetraacetic acid collection tubes and Cell-Free DNA BCT tubes), with cell-free DNA (cfDNA) subsequently purified from plasma using each of three different methods (Q Sepharose, Norgen, and QiaQuick). Next-generation DNA sequencing libraries were prepared using different library preparation techniques (SRSLY, Thruplex, and a subset of specimens using Ovation). Sequencing was performed on all libraries, the taxonomic origin of cfDNA fragments was catalogued, and the normalized abundance of species of interest in individuals with CF (CF1 and CF2) was tallied and interpreted relative to background measurements in a population of healthy individuals without CF (U1 and U2). Findings were separately compared against sputum culture results collected from participants with CF. (B) Normalized abundance of Pseudomonas aeruginosa and Achromobacter xylosoxidans cfDNA reads in participants with CF and healthy unaffected individuals. Individuals are stratified by cohort membership (participants with CF or without CF) and microbiological culture results where applicable. Gray solid line indicates the median measurement per group. Significant levels of P. aeruginosa cfDNA (z-score ⩾2, P ⩽ 0.02) and A. xylosoxidans (z-score ⩾5, P ⩽ 0.00001, due to greater population variance) relative to individuals without CF are indicated in red. Note the loge scale on the y-axes. (C) Normalized abundance of P. aeruginosa cfDNA reads shown for standard, unenriched sequencing libraries and the same libraries following whole-genome hybridization enrichment. Individuals are stratified by cohort membership (participants with CF or without CF) and by microbiological culture results where applicable. Significant levels of P. aeruginosa cfDNA (z-score ⩾2, P ⩽ 0.02) relative to individuals without CF are indicated in red. Note the loge scale on the y-axis. EDTA = ethylenediaminetetraacetic acid.

