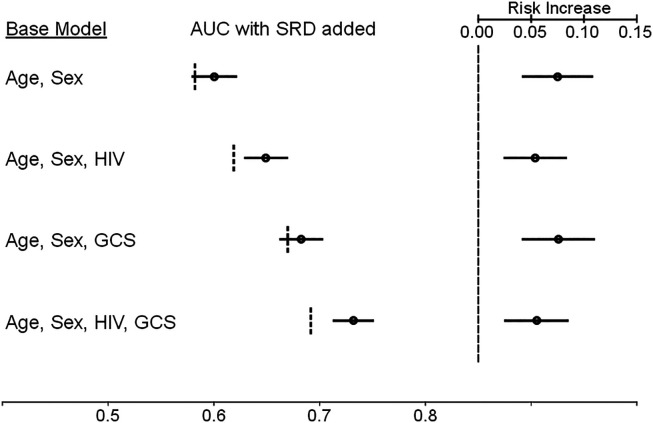
Figure 1.
Comparison of the area under the receiver operating characteristic curve (AUC) for in-hospital mortality models with and without the inclusion of admission severe respiratory disease (SRD), as defined by the World Health Organization, and the estimated mortality risk increases associated with the incorporation of SRD in each model. (Left) Each baseline risk model is provided, followed by the AUC calculated for each model. Vertical dotted lines represent the AUC for each base model. The black dot and horizontal line represent the AUC and 95% confidence interval when SRD is included as an independent variable for each base model. The AUC values are provided according to the scale at the bottom of the figure. (Right) The vertical dashed line at right represents the baseline mortality risk for each model. The black dot and horizontal line represent the estimated absolute mortality risk increase and 95% confidence interval when SRD is present in each base model. The values for the estimated absolute risk increase are provided according to the scale at the top of the figure. GCS = Glasgow Coma Scale score.

