
Figure 1.
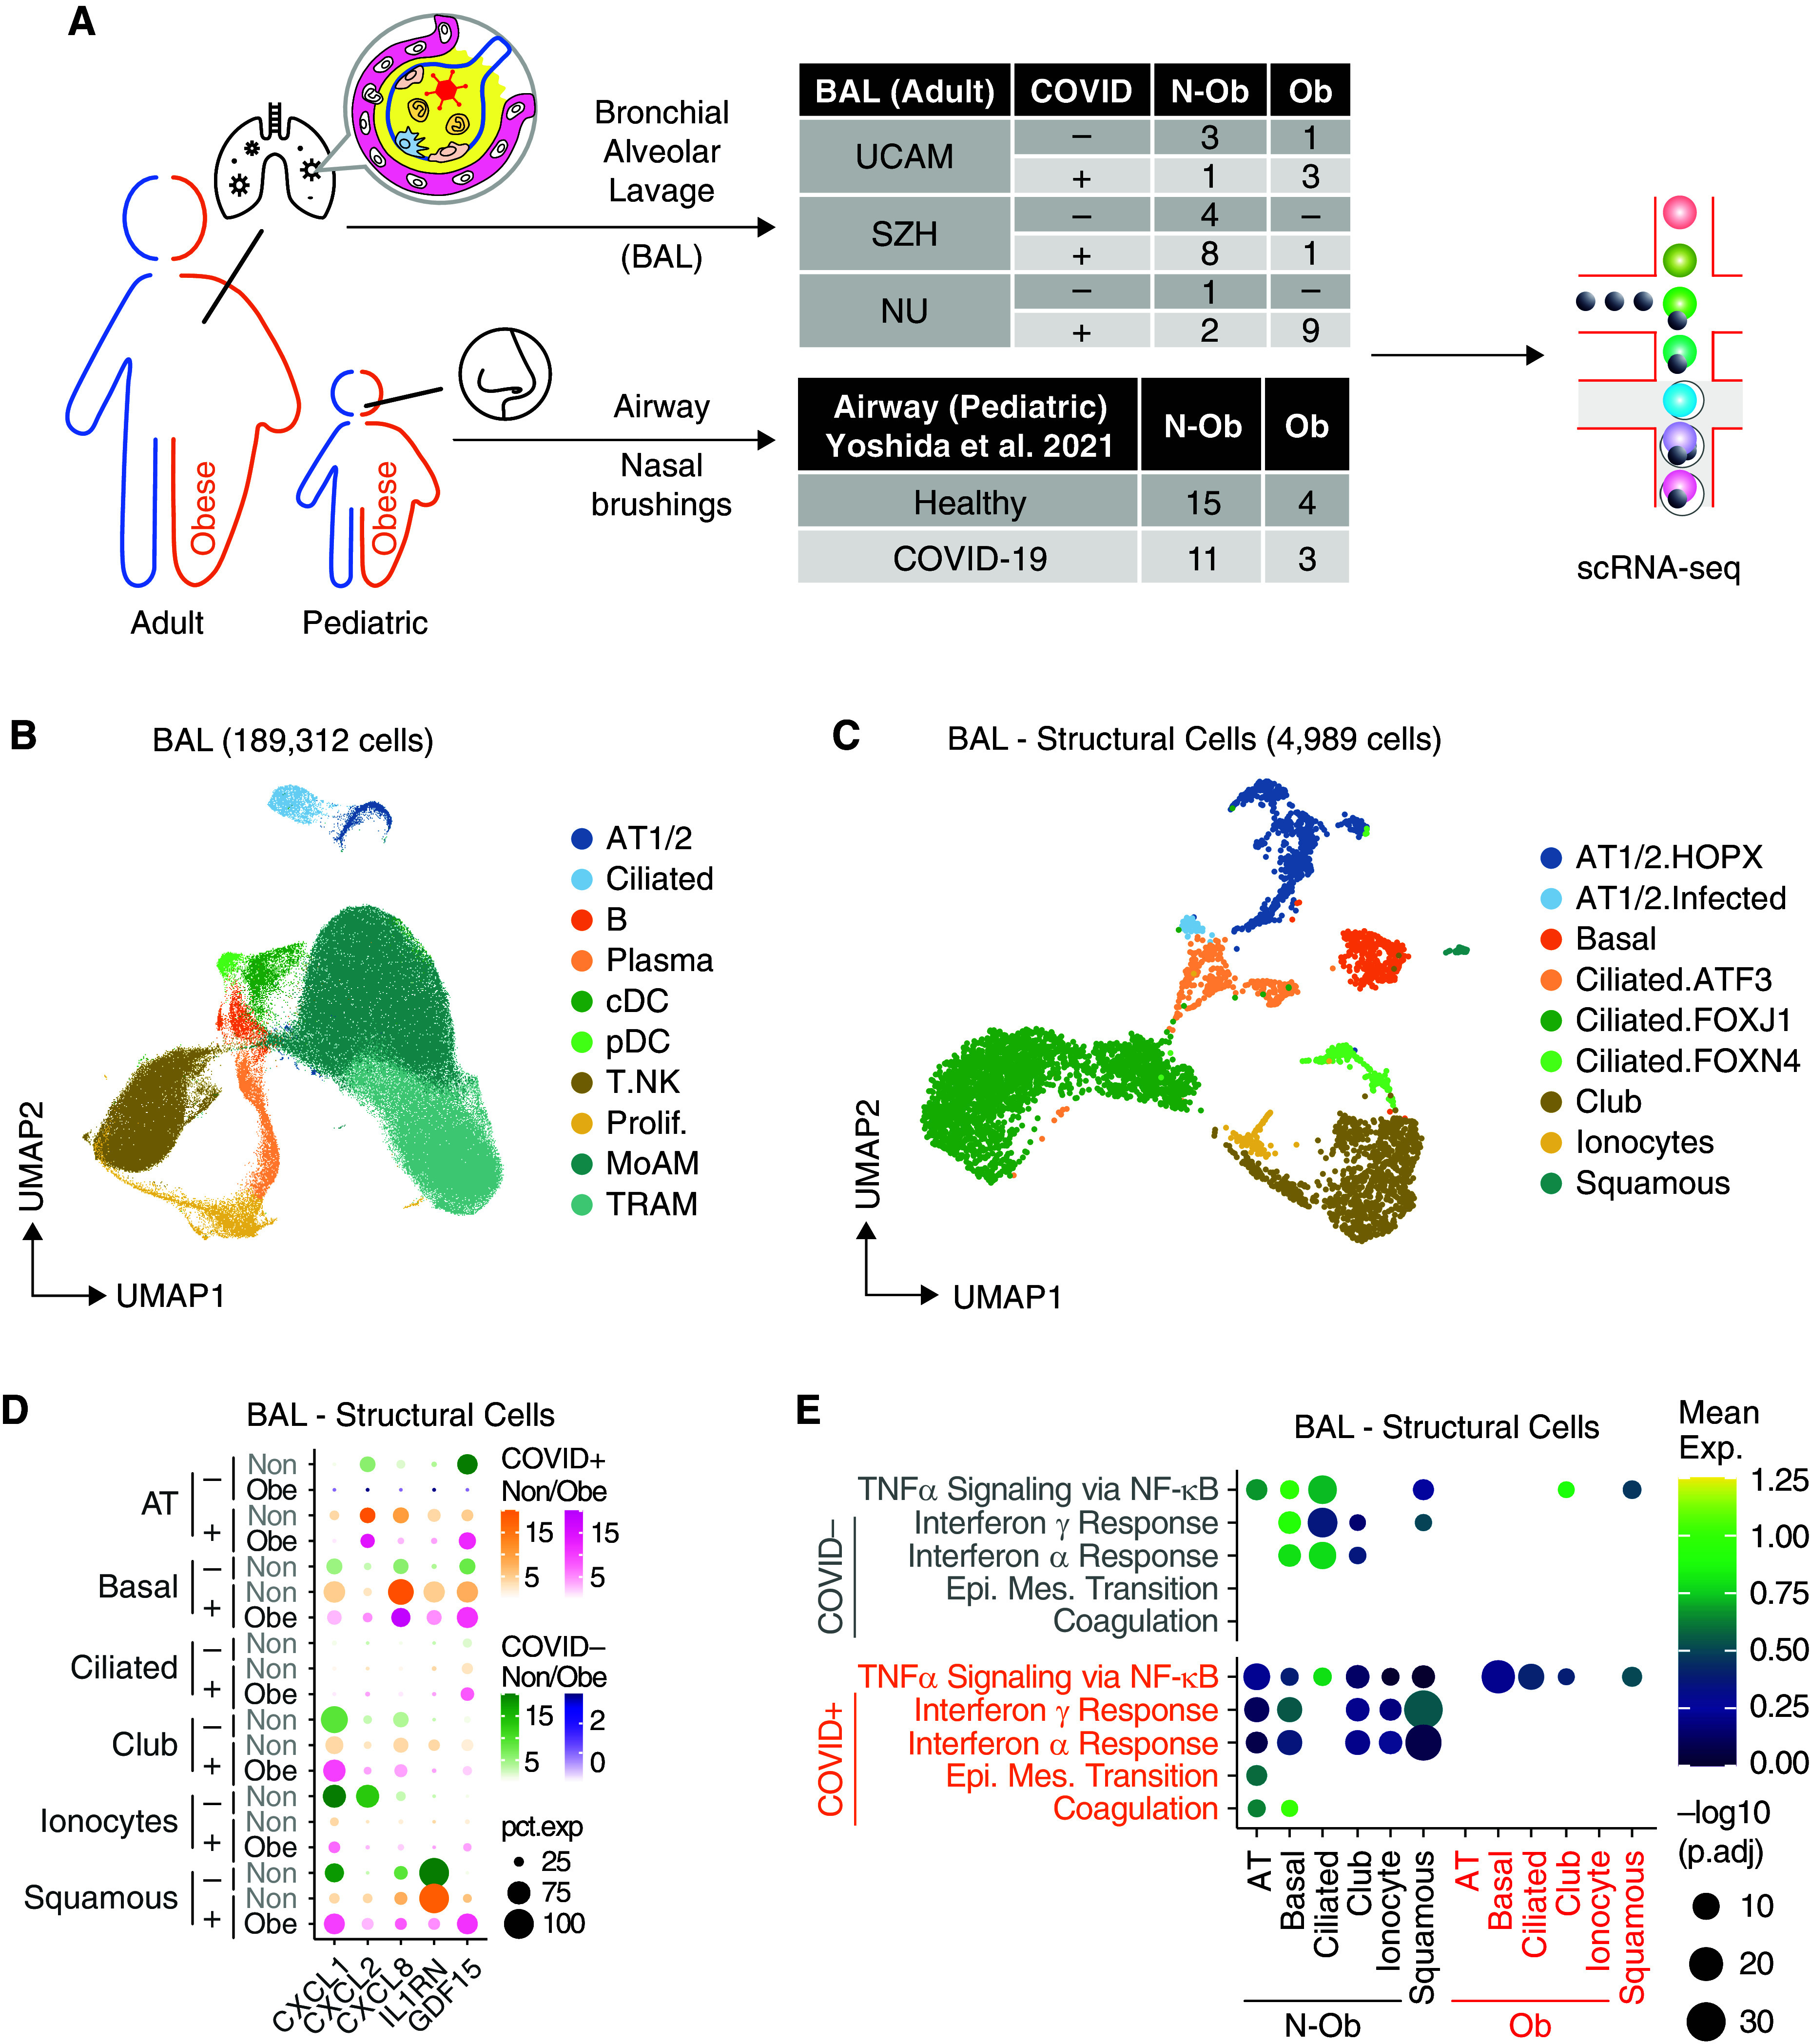
Single-cell analysis of BAL fluid samples from patients with or without coronavirus disease (COVID-19) reveals differences in gene set enrichment in structural cells in nonobese compared with obese subjects. (A) Overview of the workflow. In this study, we included BAL samples from 33 patients from three cohorts with BMI information, namely UCAM (University of Cambridge) (n = 8; ob = 3; this study), SZH (Shenzhen Third Hospital) (n = 13; ob = 1; Liao and colleagues [18]), and NU (Northwestern University) (n = 12; ob = 9; Grant and colleagues [19]). BMI data on pediatric subjects with airway sampling was obtained from Yoshida and colleagues (20). (B) Uniform manifold approximation and projection (UMAP) embedding of 189,312 cells after integration of the three datasets. Cells are colored according to harmonized broad cell type annotations. (C) UMAP embedding of 4,989 epithelial and structural cells after integration colored according to harmonized fine cell type annotations. (D) Mean expression dot plot of the top differentially expressed cytokines and chemokines in each epithelial subpopulation in the COVID+ BAL samples. Expression amounts in each case are indicated by distinct color gradients (green: nonobese without COVID-19; yellow: nonobese with COVID-19; purple: obese without COVID-19; and magenta: obese with COVID-19). Expression percentages are indicated by dot sizes. Basal, ciliated, and club cells not identified in obese without COVID-19 samples are not shown. (E) Mean expression dot plot of five most enriched immune pathways within Hallmark gene sets for epithelial/structural cells. Mean expression of genes contained in each gene set within each cell type, separated into nonobese versus obese groups, are indicated by color gradients. P values are indicated by dot sizes. AT = alveolar type; BMI = body mass index; Epi. Mes. = epithelial mesenchymal; exp = expression; N-ob = nonobese; ob = obese; pct.exp = expression percentage; Prolif. = proliferating; scRNAseq = single-cell RNA sequencing.