Figure 2.
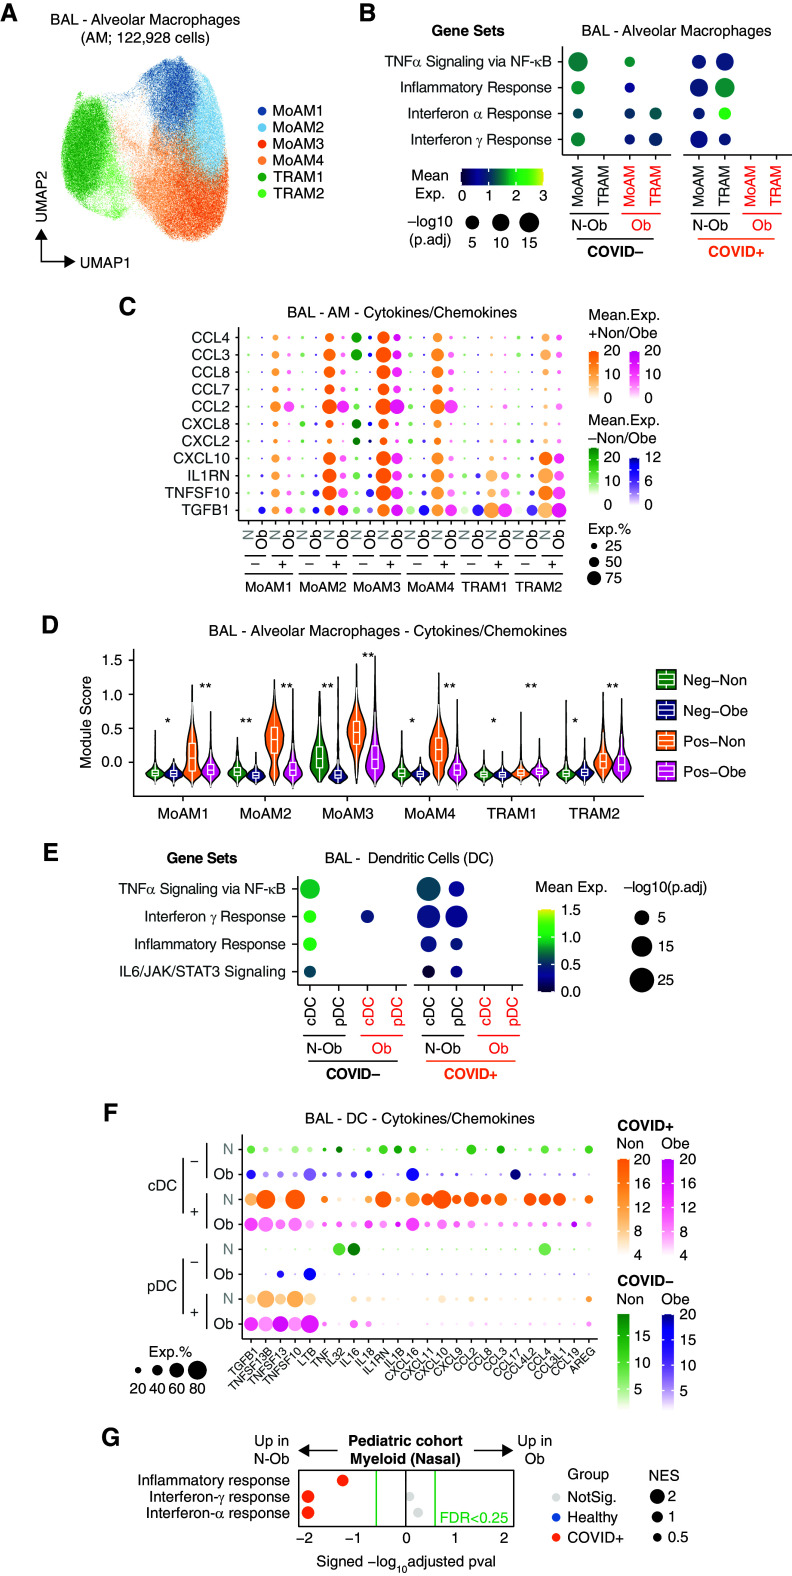
Single-cell analysis of BAL fluid samples from patients with or without coronavirus disease (COVID-19) reveals differences in gene set enrichment in myeloid cells in nonobese compared with obese subjects. (A) Uniform manifold approximation and projection (UMAP) embedding of 122,928 myeloid cells colored according to fine cell type annotation, as per Grant and colleagues (19). (B) Mean expression dot plot of most enriched immune and metabolic pathways within Hallmark gene sets for each macrophage subpopulation. Mean expression of genes contained in each gene set within each cell type, separated into nonobese versus obese and COVID− versus COVID+ groups, are indicated by color gradients. P values are indicated by dot sizes. (C) Mean expression dot plots of transcripts for the top differentially expressed cytokines and chemokines in each macrophage subpopulation in the BAL samples. Expression amounts in each case are indicated by distinct color gradients (green: nonobese without COVID-19; yellow: nonobese with COVID-19; purple: obese without COVID-19; and magenta: obese with COVID-19). Expression percentages are indicated by dot sizes. (D) Violin plot depicting mean expression amounts of transcripts for cytokines and chemokines in each macrophage subpopulation. Differences between nonobese versus obese with or without COVID-19 infection remain significant by Wilcoxon rank-sum test (*p.adj < 1 × 10⁻⁵ and **p.adj < 1 × 10⁻¹⁵). (E) Mean expression dot plot of most enriched immune and metabolic pathways within Hallmark gene sets for classical dendritic cells (cDCs) and plasmacytoid dendritic cells (pDCs). Mean expression of genes contained in each gene set within each cell type, separated into nonobese versus obese and COVID− versus COVID+ groups, are indicated by color gradients. P values are indicated by dot sizes. (F) Mean expression dot plots of transcripts for the top differentially expressed cytokines and chemokines in each DC subpopulation in the BAL samples. Expression amounts in each case are indicated by distinct color gradients (green: nonobese without COVID-19; yellow: nonobese with COVID-19; purple: obese without COVID-19; and magenta: obese with COVID-19). Expression percentages are indicated by dot sizes. (G) Dot plot of gene set enrichment analysis of Hallmark gene sets in myeloid cells from pediatric airway samples (Yoshida and colleagues [20]) between nonobese versus obese children. NES of each pathway is indicated by dot size. The color of the circles indicates which comparison was significantly enriched (healthy or COVID-19); gray circles are not significant. BH FDR 0.25 was used as the cut-off, as indicated in the figure in green text. BH FDR = Benjamini-Hochberg adjusted false discovery rate; exp = expression; MoAM = monocyte-derived macrophage; N-ob = nonobese; Neg = negative; NES = normalized enrichment score; ob = obese; Pos = positive; TNF = tumor necrosis factor; TRAM = tissue-resident macrophage.

