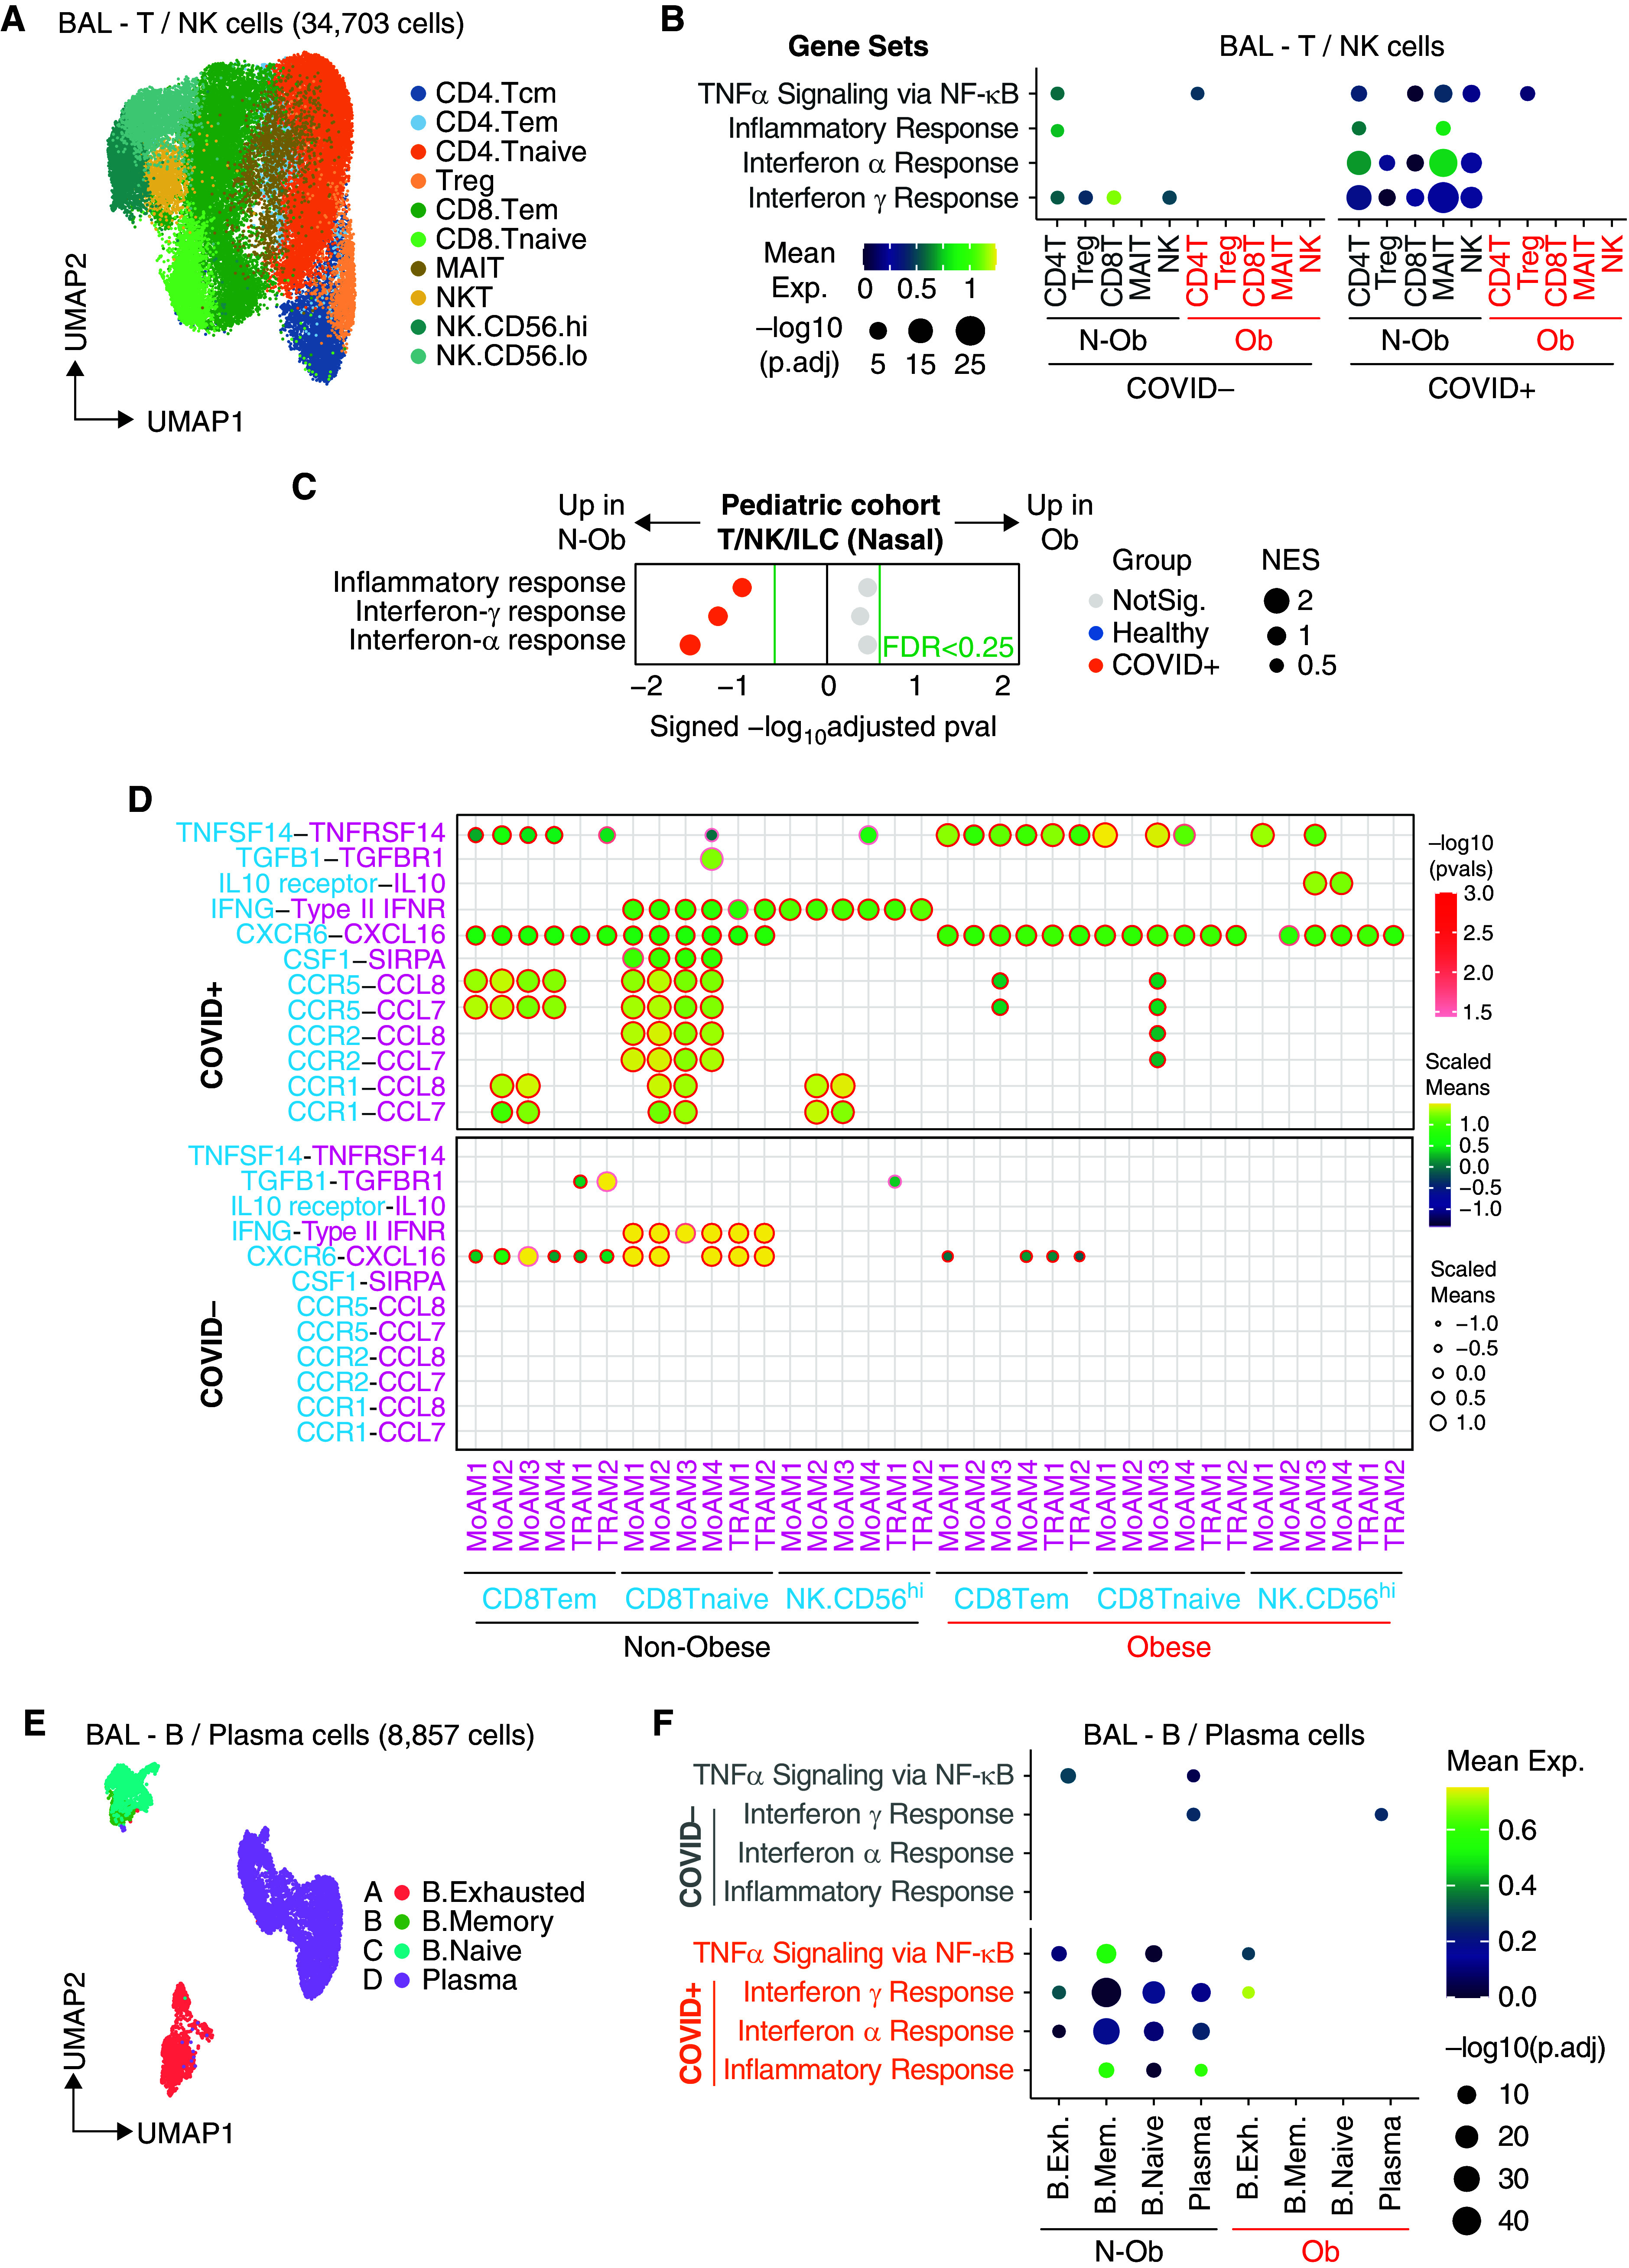
Figure 3.

Single-cell analysis of lymphocytes shows reduced enrichment of type-I and γ IFN response genes in obese patients with coronavirus disease (COVID-19). (A) Uniform manifold approximation and projection (UMAP) embedding of 34,703 T/natural killer (NK) cells after integration. CD4 T cells (Tcm [central memory T cells], Tem [effector memory T cells], Tnaive [naive T cells], and Treg [regulatory T cells]), CD8 T cells (Tem, Tnaive, and MAIT), NKT cells, and NK cells (CD56high or CD56low). (B) Dot plot of gene set enrichment analysis of top four most enriched immune pathways within Hallmark gene sets for T/NK cells. Mean expression of genes contained in each gene set within each cell type, separated into nonobese versus obese groups, are indicated by color gradients. P values are indicated by dot sizes. (C) Dot plot of gene set enrichment analysis of Hallmark gene sets in T/NK/ILC cells from pediatric airway samples (Yoshida and colleagues [20]) between nonobese and obese children. NES of each pathway is indicated by dot size. The color of the circles indicates which comparison was significantly enriched (healthy or COVID-19); gray circles are not significant. BH FDR 0.25 was used as the cut-off, as indicated in the figure in green text. (D) Ligand–receptor analysis with CellPhoneDB infers distinct interactions between CD8.Tem/CD8.Tnaive/NK.CD56hi and alveolar macrophages. The size and color gradient of circles indicate the scaled interaction score; interaction scores are scaled row-wise. The red outline indicates P < 0.05. (E) UMAP embedding of 8,857 B/plasma cells after integration colored according to harmonized fine cell type annotations. (F) Dot plot of gene set enrichment analysis of top four most enriched immune pathways within Hallmark gene sets for B/plasma cells. Mean expression of genes contained in each gene set within each cell type, separated into nonobese versus obese groups, are indicated by color gradients. P values are indicated by dot sizes. B.Exh = B. exhausted; B.Mem = B. memory; BH FDR = Benjamini-Hochberg adjusted false discovery rate; ILC = innate lymphoid cells; MAIT = mucosal-associated invariant T cells; N-ob = nonobese; NKT = natural killer T cells; NES = normalized enrichment score; NotSig. = not significant; Ob = obese; TNF = tumor necrosis factor.
