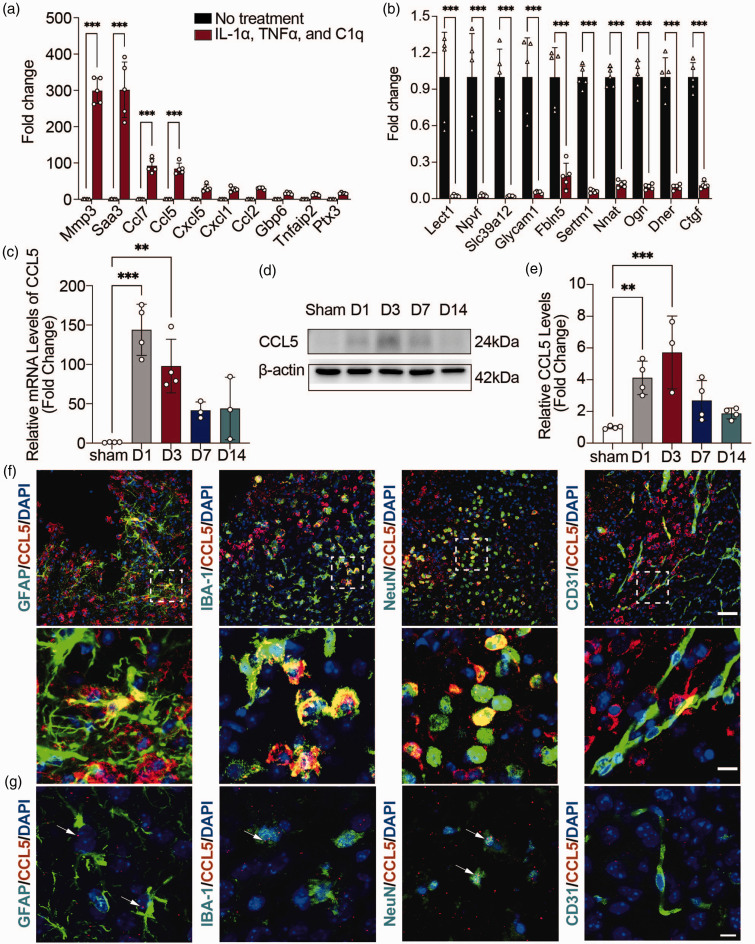
Figure 1.
CCL5 levels increased markedly in reactive astrocytes. (a, b) RT-PCR analysis of 10 upregulated (a) and downregulated (b) genes between reactive astrocytes and resting astrocytes. n = 5 biologically independent primary astrocytes cultures. GAPDH was used as an internal control. Two-way ANOVA with Bonferroni multiple comparisons test. (c) RT-PCR analysis of CCL5 mRNA expression levels in the hemorrhagic perifocal area at 1, 3, 7, and 14 days after ICH. n = 4 mice in Sham/D1/D3 groups (all male), n = 3 mice in D7 and D14 groups (all male). GAPDH was used as an internal control. One-way ANOVA with Dunnett’s multiple comparisons test. (d) Representative immunoblots of CCL5 protein expression levels in the hemorrhagic perifocal area at 1, 3, 7, and 14 days after ICH. (e) Quantification of CCL5 protein expression levels in the hemorrhagic perifocal area at 1, 3, 7, and 14 days after ICH. n = 4 mice in Sham/D1/D7/D14 groups (all male), n = 3 mice in D3 group (all male). β-actin was used as an internal control. One-way ANOVA with Dunnett’s multiple comparisons test. (f) Representative immunostaining images of CCL5 (red) with astrocytes (GFAP, green), microglia (Iba-1, green), neurons (NeuN, green), and ECs (CD31, green) in the hemorrhagic perifocal area at day 3 of ICH. Above scale bar = 50 μm, below scale bar = 10 μm and (g) Representative RNAscope images of CCL5 mRNA (red) with astrocytes (GFAP, green), microglia (Iba-1, green), neurons (NeuN, green), and ECs (CD31, green) in the hemorrhagic perifocal area at day 3 of ICH. Scale bar = 10 μm. Arrows indicated the colocalization of astrocytes, microglia, and neurons with CCL5 mRNA, respectively. All data are presented as mean ± SD. **p < 0.01, ***p < 0.001.

