Figure 2.
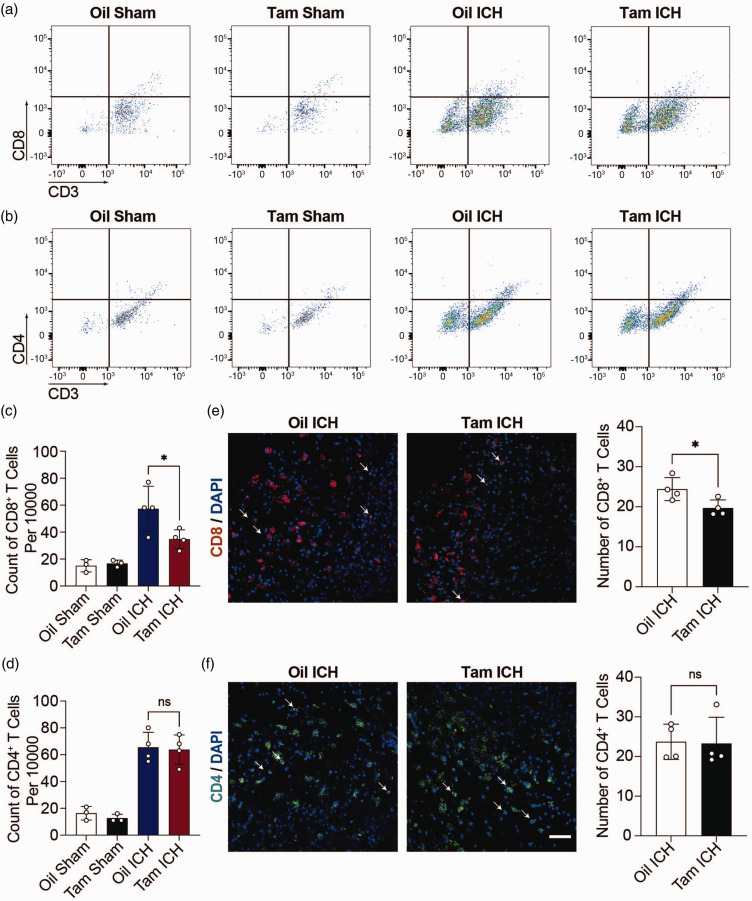
Knockout CCL5 in astrocytes reduced CD8+ T infiltration. (a, b) Representative flow cytometry pseudocolor dot plots showed gating strategy of CD8+ T cells (CD3+ CD8+) (a) and CD4+ T cells (CD3+ CD4+) (b) in Aldh1l1CreERT2+/−: CCL5f/f sham mice treated with oil (Oil Sham) or tamoxifen (Tam Sham), Aldh1l1CreERT2+/−: CCL5f/f hemorrhagic stroke mice treated with oil (Oil ICH) or tamoxifen (Tam ICH). (c, d) The count of CD8+ T cells (CD3+ CD8+) (c) and CD4+ T cells (CD3+ CD4+) (d) per 10000 cells in Oil Sham, Tam Sham, Oil ICH and Tam ICH groups. n = 3 mice in Oil Sham group and Tam Sham group (1 female, 2 male), n = 4 mice in Oil ICH group (1 female, 3 male), n = 4 mice in Tam ICH group (2 female, 2 male). One-way ANOVA with Tukey’s multiple comparisons test. (e) Representative immunostaining images of CD8+ T cells (red) in the hemorrhagic perifocal area at day 3 of ICH. Arrowheads indicate CD8+ T cells. The number of CD8+ T cells in Oil ICH and Tam ICH groups in the hemorrhagic perifocal area at day 3 of ICH. n = 4 mice per group (all male). Two-sided, unpaired Student’s test and (f) Representative immunostaining images of CD4+ T cells (green) in the hemorrhagic perifocal area at day 3 of ICH. Scale bar = 50 μm. Arrowheads indicate CD4+ T cells. The number of CD4+ T cells in Oil ICH and Tam ICH groups in the hemorrhagic perifocal area at day 3 of ICH. n = 4 mice per group (all male). Two-sided, Mann-Whitney test. All data are presented as mean ± SD. *p < 0.05, ns, no significance.

