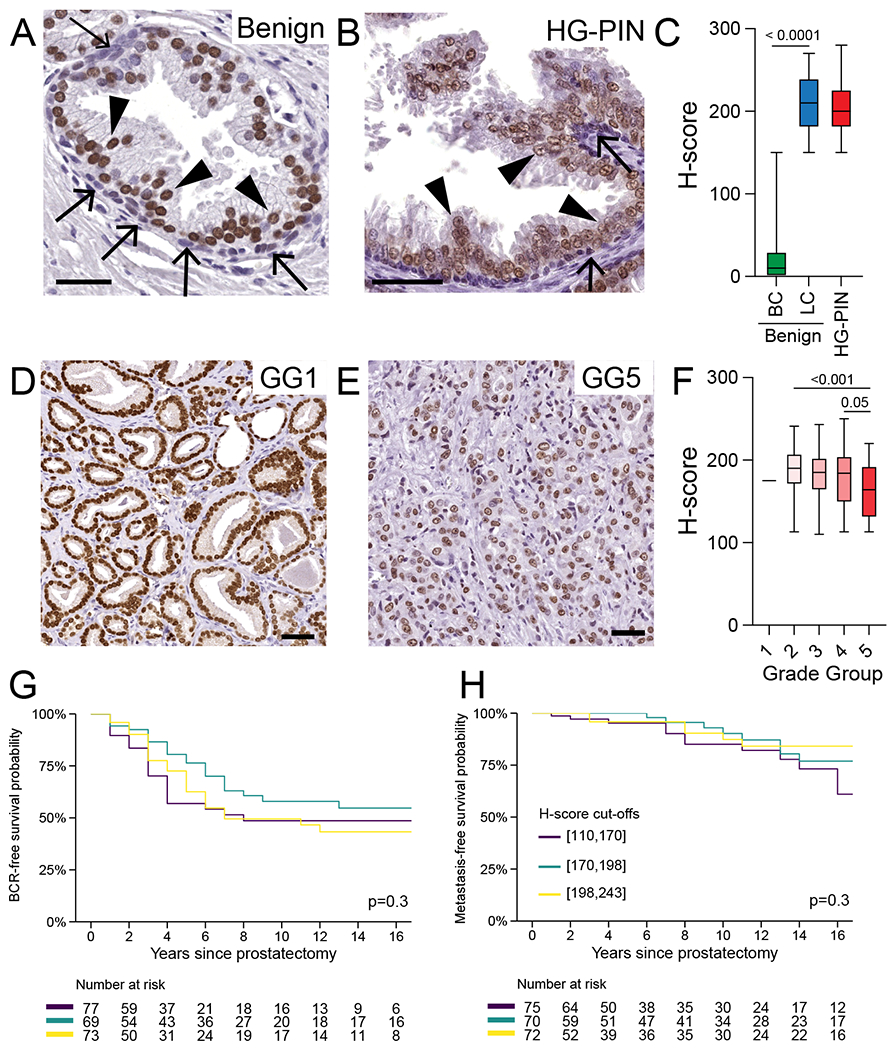
FIGURE 3. HOXB13 expression in adult prostate tissue and localized prostate cancer.

A. HOXB13 expression in benign prostate tissue. Note the higher level of HOXB13 expression luminal (arrowheads) versus basal (arrows) cells. B. Semiquantitative assessment of HOXB13 expression in benign prostatic luminal and basal cells (N=12) C. Comparison of HOXB13 expression in benign luminal cells, high-grade prostatic intraepithelial neoplasia (HG-PIN) and invasive carcinoma (N=12). D. Representative micrographs of HOXB13 expression in HG-PIN. E. Box-plots showing HOXB13 expression across grade groups (GG) and pathological stage. F. Micrographs showing HOXB13 reactivity in grade group 1 (GG1) and GG5. Kaplan-Meier plots shows G. biochemical recurrence-free (BCR) and H. metastasis-free survival. Colored lines indicate tertiles of HOXB13 H-scores. Scale bars denote 50 μm.
