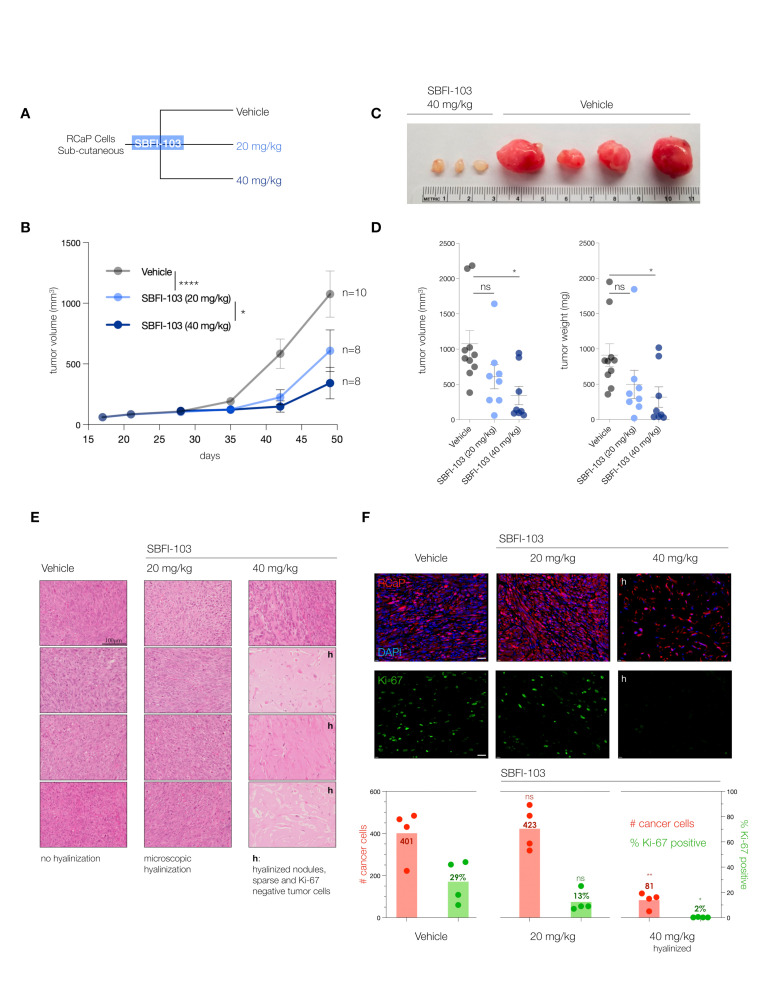
Figure 4.
(A), Treatment scheme for in vivo testing of SBFI-103 at two doses in sub-cutaneously transplanted RCaP cells. (B), Tumor volumes and treatment effects in the three trial arms: vehicle, n = 10; SBFI-103 at 20 mg/kg, n = 8; SBFI-103 at 40 mg/kg, n = 8. Data are mean ± s.e.m. p values were calculated from a mixed-effects model (restricted maximum likelihood (REML)). The p values for comparison of vehicle with SBFI at 20 mg/kg (**** p < 0.0001) and SBFI at 20 mg/kg compared with 40 mg/kg (* p < 0.05) are indicated in the graph. The p value for comparison of vehicle with SBFI at 40 mg/kg is *** p < 0.001. (C), macroscopic analysis of select resected tumors from (B). See Supplementary Figure S3A for further examples. (D) Comparison of tumor volumes (left) and weights (right) among the three trial arms. Data are mean ± s.e.m. p values were calculated using one-way ANOVA with Dunnett’s post hoc test. Ns, not significant. * p < 0.05, **** p < 0.0001. (E) Histopathology analysis of lesions from (B) by H&E staining. “h” denotes high degree of hyalinization. Scale bar, 100 µm. (F), Top, Immunofluorescence analysis of histology slides from E showing RCaP cancer cells (red, tdTomatoFP), DAPI (blue), and anti-Ki-67 staining (green) in representative examples of the three trial arms. Scale bar 100 µm. Bottom, quantification of cancer cell number and percent Ki-67 positive cells per field for vehicle and 20 mg/kg trial arms and for hyalinized nodules of the 40 mg/kg trial arm (n = 4). p values were calculated using two-tailed Student’s t-test. * p < 0.05, ** p < 0.01.

