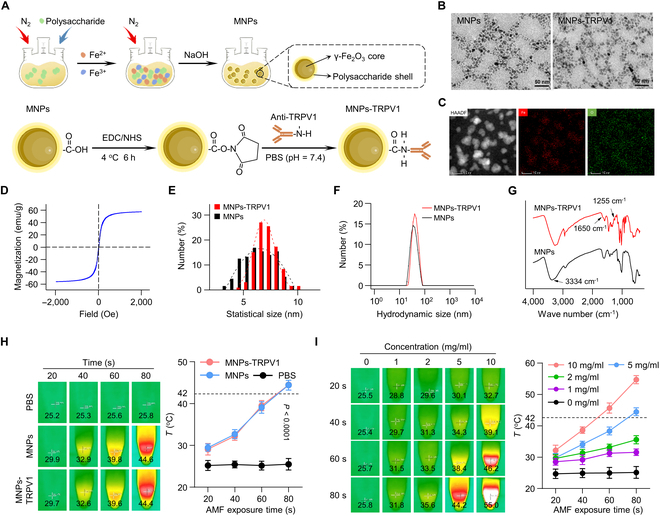
Fig. 2.

Preparation and characterization of MNPs-TRPV1. (A) Schematic diagram of the synthesis of MNPs-TRPV1. (B) TEM images of MNPs and MNPs-TRPV1. (C and D) Elemental mapping (C) and hysteresis loop (D) of MNPs. (E to G) Statistical size (E), hydrodynamic size (F), and FT-IR spectra (G) of MNPs and MNPs-TRPV1. (H) Heating curves of the PBS, MNPs, and MNPs-TRPV1 upon various AMF exposure time. (I) Heating curves of various concentrations of MNPs-TRPV1 upon various AMF exposure time. The dotted line represents activation threshold (42 °C) of TRPV1.
