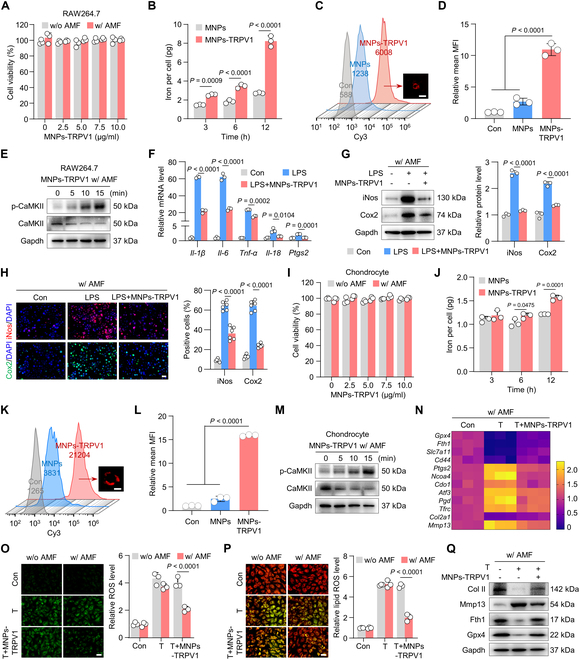
Fig. 3.

Magnetothermal suppression of macrophagic inflammation and chondrocyte ferroptosis by MNPs-TRPV1. (A) Cell viability of RAW264.7 macrophages treated with different concentrations of MNPs-TRPV1 with (w/) or without (w/o) AMF stimulation. (B) The inductively coupled plasma mass spectrometry (ICP-MS) detection of iron content per RAW264.7 cell after incubated with 5 mg/ml MNPs or MNPs-TRPV1 for 3, 6, and 12 h. (C and D) Flow cytometry analysis (C) and quantitative analysis (D) of sulfo-cyanine3 (Cy3) conjugated MNPs or MNPs-TRPV1 incubated RAW264.7 cells for 12 h. The representative image presented in (C) showed the combination of MNPs-TRPV1 to the plasma membrane of RAW264.7 cell. (E) Western blot analysis of the expression levels of CaMKII and p-CaMKII in RAW264.7 cells 0, 5, 10, and 15 min after the treatment of MNPs-TRPV1 with AMF stimulation. (F) qPCR analysis of inflammatory genes, including Il-1β, Il-6, Tnf-α, Il-18, and Ptgs2, in RAW264.7 cells treated with or without 50 ng ml−1 LPS in the presence or absence of MNP-TRPV1 pretreatment under AMF exposure. (G) Western blot analysis (left panel) and corresponding quantitative analysis (right panel) of the expression of inflammatory proteins, iNos and Cox2, expressed in RAW264.7 cells induced as indicated. (H) Immunofluorescence staining (left panel) and quantitative analysis (right panel) of iNos and Cox2 in RAW264.7 cell induced as indicated. (I) Cell viability of mouse primary chondrocytes treated with various concentrations of MNPs-TRPV1 with (w/) or without (w/o) AMF stimulation. (J) The ICP-MS detection of iron content per chondrocyte after incubated with 5 mg/ml MNPs or MNPs-TRPV1 for 3, 6, and 12 h. (K and L) Flow cytometry analysis (C) and quantification (D) of Cy3-conjugated MNPs or MNPs-TRPV1 incubated chondrocytes for 12 h. The representative image presented in (K) showed the combination of MNPs-TRPV1 to the plasma membrane of chondrocyte. (M) The proteins expression levels of CaMKII and p-CaMKII in chondrocytes treated as indicated at the time point of 0, 5, 10, and 15 min. (N) qPCR analysis of gene expression levels of ferroptosis suppressors (Gpx4, Fth1, Slc7a11, and Cd44), ferroptosis drivers (Ptgs2, Ncoa4, Cdo1, Atf3, Pgd, and Tfrc), cartilage anabolic marker (Col2a1), and cartilage catabolic marker (Mmp13) in chondrocytes treated as indicated. (O and P) Representative images (left panel) and quantification (right panel) of ROS (O) and lipid ROS (P) levels in mouse primary chondrocytes treated with TBHP (T) or T + MNPs-TRPV1 under the stimulation of AMF. (Q) Western blot analysis of expression levels of Col II, Mmp13, Fth1, and Gpx4 in chondrocytes treated as indicated. w/o, without; w/, with. Scale bars, 15 μm (C and K), 20 μm (H) and 50 μm (O and P). One-way (D, F, G, H, and L) or 2-way (A, B, I, J, O, and P) ANOVA with Tukey’s post hoc test. Data are shown as mean ± SD.
