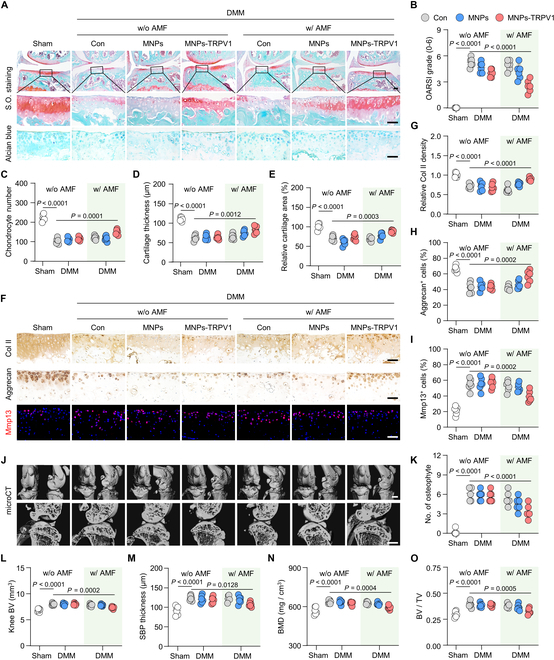
Fig. 6.

MNPs-TRPV1 under AMF stimulation alleviates OA progression. (A to E) Safranin-O/fast green (S.O.) and Alcian blue staining (A) and the corresponding quantification of Osteoarthritis Research Society International (OARSI) grade (B), chondrocyte number (C), cartilage thickness (D), and relative cartilage area (E) in the articular cartilage of mice treated by MNPs or MNPs-TRPV1 in the presence or absence of AMF exposure. (F to I) Immunohistochemical staining (F) and quantification of Col II (G) and Aggrecan (H), as well as immunofluorescence staining (F) and quantitative analysis (I) of Mmp13 in the cartilage of mice treated as indicated. (J) micro-CT analysis and 3D reconstructed images of mice knee joints, as well as the sagittal view of the medial joint compartment unveiling the changes to tibial and femoral surfaces and subchondral bone plate (SBP) thickness, respectively. (K to O) Quantitative analysis of the number (No.) of osteophyte (K), knee bone volume (BV) (L), SBP thickness (M), subchondral bone mineral density (BMD) (N), and the ratio of subchondral bone volume to tissue volume (BV/TV) (O) in the knee of mice treated as indicated. w/o, without; w/, with. Scale bars: 100 μm (upper panel of (A)), 50 μm (lower panel of (A) and (F)), and 1 mm (J). One-way ANOVA with Tukey’s post hoc test. Data are shown as mean ± SD.
