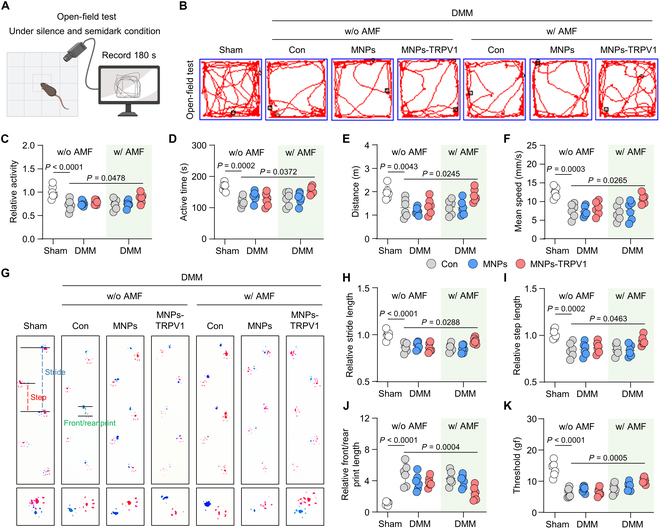
Fig. 7.

MNPs-TRPV1 improves behavior performance of mice. (A) Schematic illustration of the open field test. (B to F) Representative track plots of mice spontaneous activity in open field tests (B) and quantitative analysis of relative mice activity (C), active time during the 180 s experimental period (D), move distance (E), and mean speed (F). (G) Gait analysis of mice treated as indicated. Blue dot line, stride length; red dot line, step length; green dot line, front/rear print. Red print, fore paws; blue print, hind paws. (H and I) Quantification of mice foot prints including relative stride length (H), relative step length (I), and relative front/rear print length (J). (K) Mechanical sensitivity of mice was measured by von Frey tests. w/o, without; w/, with. One-way ANOVA with Tukey’s post hoc test. Data are shown as mean ± SD.
