

SUMMARY
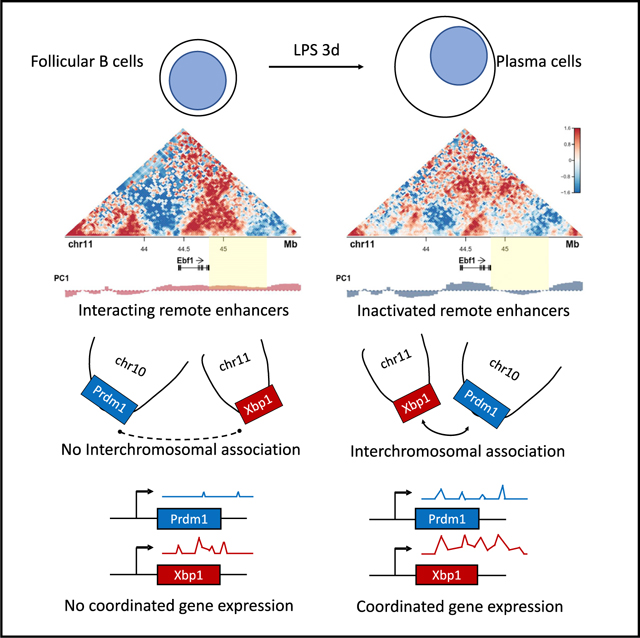
The transition from the follicular B to the plasma cell stage is associated with large-scale changes in cell morphology. Here, we examine whether plasma cell development is also associated with changes in nuclear architecture. We find that the onset of plasma cell development is concomitant with a decline in remote genomic interactions; a gain in euchromatic character at loci encoding for factors that specify plasma cell fate, including Prdm1 and Atf4; and establishment of de novo inter-chromosomal hubs. We find that, in developing plasma cells and concurrent with transcriptional silencing, the Ebf1 locus repositions from an euchromatic to peri-centromeric heterochromatic environment. Finally, we find that inter-chromosomal hubs are enriched for the deposition of either H3K27Ac or H3K27me3. These data indicate that plasma cell fate is orchestrated by elaborate changes in genome topology and that epigenetic marks, linked with super-enhancers or transcriptionally repressed regions, are enriched at inter-chromosomal hubs.
In Brief
Bortnick et al. demonstrate that plasma cell fate is associated with changes in chromatin folding, inter-chromosomal interactions, and nuclear localization involving plasma-cell-specific genes. Inter-chromosomal hubs in maturing B cells are enriched for the deposition of either H3K27Ac or H3K27me3. We propose that deposition of these marks facilitates inter-chromosomal interactions.
Graphical Abstract
INTRODUCTION
The genome is folded into chromosome territories that, with the exception of nucleoli, rarely intermingle (Sexton and Cavalli, 2015; Maharana et al., 2016). Chromosomes themselves are organized as tandem arrays of loops that interact to establish euchromatic (A) or heterochromatic (B) compartments (Lieberman-Aiden et al., 2009). Although the euchromatic (active) compartment is predominantly positioned in the nuclear interior, a large fraction of the heterochromatic (silenced) compartment is associated with the nuclear lamina (Kind et al., 2015; Peric-Hupkes et al., 2010). During developmental progression, regulatory and coding elements often reposition from the lamina to the nuclear interior and vice versa to modulate patterns of gene expression (Lin et al., 2012; Isoda et al., 2017). An additional layer of chromatin architecture involves the assembly of nuclear bodies, such as nucleoli and perinucleolar heterochromatin, which, similar to the nuclear lamina, have been associated with inactive gene transcription (Huang et al., 1997; Kind et al., 2013).
Plasma cells are terminally differentiated B cells responsible for maintaining protective serum antibody titers that serve as a first line of defense against infection (Slifka et al., 1998). Plasma cells are also a source of pathogenic auto-antibodies and, in malignancy, the origin of plasmacytomas, light-chain amyloidosis, monoclonal gammopathies, and multiple myeloma (Hiepe et al., 2011; Chesi and Bergsagel, 2013). In response to pathogens, naive B cells (also referred to as interphase, mature, resting, or quiescent) rapidly proliferate to form a population of activated B cells, which further differentiate into germinal center B cells or extra-follicular antibody-secreting plasma cells (also referred to as plasmablasts). Experiments tracking antigen-specific responses over hundreds of days have revealed plasma cell subsets with varying lifespans (Chernova et al., 2014; Hammarlund et al., 2017). These findings raise questions about the minimum genomic requirements to establish plasma cell identity. One recent study identified Pax5 as an important genome organizer for developing B cells (Johanson et al., 2018). Other studies linking B cell differentiation to chromatin reorganization events have focused on activated B cells (24 h after stimulation), germinal center B cells, or mixed populations of activated and differentiated cells (Kieffer-Kwon et al., 2013, 2017; Bunting et al., 2016; Park et al., 2014).
B cell development relies on a highly regulated and hierarchical program of gene expression. In early B cells, the basic-helix-loop-helix (bHLH) protein E2A induces the expression of FOXO1 and early B cell factor 1 (EBF1), which in turn activates the expression of FOXO1 in a feedforward loop, ultimately activating PAX5 expression (Mansson et al., 2012). Numerous transcription factors, including Prdm1 and Irf4, have been shown to orches trate the onset of plasma cell development. Repression of early B cell genes, including Pax5, is also central to initiation of the plasma cell program, as forced expression of Pax5 interferes with antibody secretion (Lin et al., 2002). In contrast, sustained combined expression of E2A (Tcf3) and E2–2 (Tcf4) are crucial to the plasma cell program (Wöhner et al., 2016; Gloury et al., 2016; Chen et al., 2016). Plasma cells also constitutively activate the unfolded protein response (UPR), a specializing sensing mechanism for detecting and processing large amounts of protein shuttled through the endoplasmic reticulum (ER1). The three sensors known to implement the UPR pathway are inositol-requiring enzyme 1 (IRE 1), PKR-like ER kinase (PERK), and activating transcription factor 6 (ATF6) (Bettigole and Glimcher, 2015). IRE1 oligomerizes and activates ribonucleases, which splice x-box-binding protein 1 (XBP1) mRNA. PERK oligomerizes and phosphorylates eukaryotic translation initiation factor 2α (eIF2α). Phosphorylated eIF2α inhibits global protein translation while favoring translation of activating transcription factor 4 (ATF4) mRNA. ATF4 increases ER capacity.
Despite their essential role in health and disease, our insight into how the genomes of naive B and plasma cells are organized in 3D space remains rudimentary. Initial studies in developing B cells demonstrated that, during the pre-pro-B to pro-B cell transition and beyond, the genome undergoes large-scale changes in nuclear architecture (Lin et al., 2012; Johanson et al., 2018). Here, we map nuclear architectural changes that occur during plasma cell differentiation. We find that the onset of plasma cell development is associated with intricate and elaborate refolding of chromatin involving genes encoding for critical developmental regulators and accumulation of transcripts encoding for key developmental regulators into shared transcriptional hubs. Specifically, we found that an ensemble of genomic regions encoding for factors that orchestrate plasma cell fate switched nuclear locations involving the nuclear lamina, peri-centromeric heterochromatin, and euchromatin. Finally, we found that inter-chromosomal hubs were significantly enriched for the deposition of either H3K27Ac or H3K27me3. We propose that the deposition of these marks facilitate inter-chromosomal interactions, plausibly involving an ensemble of cross-links that collectively established a weak gel state.
RESULTS
Single-Cell RNA Sequencing of Follicular B and Plasma Cell Transcriptomes Reveals Commonalities among Subsets
To identify transcription signatures associated with differentiating plasma cells, we performed single-cell RNA sequencing (scRNA-seq) analyses for naive follicular B cells as well as purified plasma cell populations. Specifically, follicular naive B cells (CD23+) were isolated from mice that carry a GFP reporter allele within the Prdm1 locus (Kallies et al., 2004), which were then activated to generate in vitro derived plasma cells. Short-lived (GFP+B220+) and long-lived (GFP+B220−) plasma cells were sorted from the bone marrow and spleen derived from Prdm1-GFP mice. We used the 103 Genomics Chromium platform for sequencing and recuperated 500–53,931 reads per cell, depending on the cell type, with ~88.8%–93.2% of uniquely mapped reads. A total of 9,782 genes were detected across the dataset; 7,803 genes showed a mean expression of at least 1 transcript per million reads (TPM) per cell. We used an unsupervised t-Distributed Stochastic Neighborhood Embedding (t-SNE) analysis to identify the transcriptomes associated with the isolated populations. Each of the purified populations segregated as distinct clusters (Figure 1A). Plasma cells derived from 3-day in vitro LPS-activated follicular B cell cultures displayed substantial overlap with short-lived plasma derived from the spleen or bone marrow (Figure 1A). Long-lived plasma cells derived from the bone marrow segregated into two clusters, one of which showed overlap with short-lived plasma cells, whereas a second group of long-lived plasma cells clustered independently (Figure 1A). We next plotted the expression patterns for a selected group of genes in follicular B, LPS-activated B, short-lived, and long-lived plasma cells (Figure 1B). As a first approach, we compared expression levels derived from scRNA-seq analysis to those derived from bulk RNA-seq reads. We found that merging of scRNA-seq reads yielded comparable expression levels as compared to those obtained from bulk RNA-seq analysis (Figure S1). Genes encoding for proteins specific to the plasma cell fate, including Prdm1, Tcf4, Xbp1, Irf4, and Atf4, were expressed in the short-lived and long-lived plasma compartments (Figures 1B, S1B, and S1C). Tcf3 was expressed in both naive follicular B and plasma cells consistent with previous observations (Quong et al., 1999; Chen et al., 2016). Ebf1, Bach2, Pax5, and Id3 were primarily expressed in naive follicular B cells, but not in short-lived or long-lived plasma cells (Figures 1B and S2A). As expected, Cd86 and c-myc expression were enriched in LPS-activated follicular B cells but downregulated in plasma cells (Figure 1B). Gene ontology analysis for the different B cell populations revealed that, as expected, plasma cell differentiation was closely associated with genes encoding for components of the endoplasmic reticulum as well as the UPR (Figure S2B). Long-lived plasma cells were significantly enriched for genes encoding for components of the ribosome machinery and DNA replication as compared to short-lived plasma cells (Figure S2B). To determine whether and how Prdm1, Xbp1, and Atf4 expression is correlated, we plotted the UMIs (unique molecular identifiers) per million reads (UPM). We found that Prdm1 expression correlated well with Xbp1 and Atf4 expression (Figure 1C). To validate these findings, we performed nascent transcript RNA-fluorescence in situ hybridization (FISH). Specifically, Blimp-GFP cells were sorted, formaldehyde fixed, and hybridized with fluorescently labeled intronic Prdm1, Atf4, and Xbp1 probes (Figure 1D). Consistent with the scRNA-seq analysis, Xbp1 and Prdm1 as well as Atf4 and Prdm1 showed coordinate expression (Figure 1E). To determine the relationship between Prdm1, Xbp1, and Atf4 expression, we calculated the Pearson correlation. We found significant synergy in Xbp1 and Prdm1 expression. Specifically, the Pearson correlation between Prdm1 and Xbp1 transcript foci was 0.601 (chi-square p = 1.21e–6) and 0.442 involving Prdm1 and Atf4 expression (chi-square p = 1.32e–1; Figure 1E). Taken together, these data indicate that the establishment of plasma cell fate is concomitant with the expression of genes associated with the UPR, endoplasmic reticulum biogenesis, ribosome biogenesis, and coordinate regulation of genes encoding for key transcriptional regulators.
Figure 1. Unique Gene Expression Profiles for In Vitro and In Vivo Derived Plasma Cells.

(A) t-SNE plot of single-cell RNA-seq dataset. Each dot is a single cell. Color of dot indicates the cell type.
(B) Heatmap of manually selected genes. Each row is a cell. Each column is a gene. Red indicates higher transcriptional activity, although blue indicates lower transcriptional activity. Row-side color bar indicates the cell type, with color legend on the left.
(C) Dot plots of gene expression single-cell RNA-seq reads; each dot is a single cell. The unit of the plots is UMI per million. Color of dot represents cell type.
(D) Locations of probe regions used for RNA-FISH experiments. Example images of RNA-FISH for Prdm1 and Atf4 (top row) or Prdm1 and Xbp1 (bottom row) in day 3 sorted GFP+ plasma cells are shown.
(E) Heatmaps displaying the number of cells that express different combinations of intronic RNA-FISH spots. Colors display the most prevalent (darkest) combination to rarest (lightest) combination. Chi-square test measuring the likelihood that the expression of Prdm1 and Xbp1 is independent of each other: p = 1.21e–06, Pearson correlation = 0.601 (left). Chi-square test measures the likelihood that the expression of Prdm1 and Atf4 are independent of each other: p = 1.32e–01; Pearson correlation = 0.442 (right).
The Plasma-Cell-Specific Transcription Signature Is Associated with Changes in Compartmentalization
In previous studies, we found that the onset of B cell development was closely associated with changes in chromatin topology that correlated well with alterations in gene expression (Lin et al., 2012). To determine whether likewise the onset of a plasma-cell-specific transcription signature was also linked with changes in genome topology, we performed genome-wide tethered chromosomal conformation capture analysis (TCC) (Kalhor et al., 2011). Specifically, follicular naive B cells (CD23+) were isolated from mice carrying a GFP reporter allele within the Prdm1 locus (Kallies et al., 2004), which were then activated in vitro to generate plasma cells. As expected, the average intra-chromosomal contact probability as a function of genomic distance revealed that the TCC reads for both naive B and plasma cells decay as a function of genomic distance (Figure 2A). Notably, however, compared to follicular B cells, plasma cells were depleted for intra-chromosomal interactions separated more than 10 Mb but enriched for intra-chromosomal interactions that spanned less than 10 Mb (Figure 2A). Specifically, Kolmogorov-Smirnov test yielded a value of <2.2e–16, indicating different contact maps for naive versus plasma cells. Circos plots derived from contact maps associated with naive follicular and plasma cells confirmed enrichment for intra-chromosomal genomic interactions that primarily involved euchromatic regions as denoted by principal component (PC) 1+ regions (Figure 2B).
Figure 2. Plasma Cell Differentiation Is Associated with a Loss of Remote Genomic Interactions.
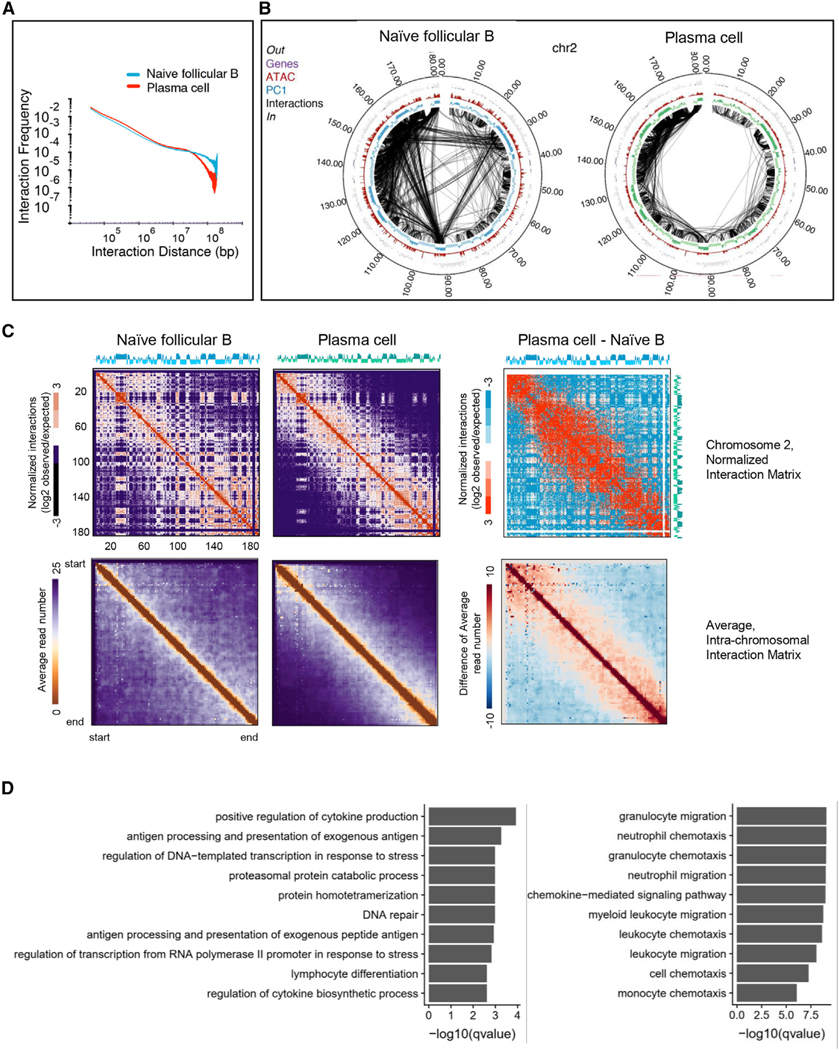
(A) Intra-chromosomal interaction frequencies across the genome at 50-kb resolution for naive B cells and plasma cells. Log scales are shown.
(B) Circos plot of significant intra-chromosomal interactions within chromosome 2 for naive B and plasma cells. Interactions with p values less than 10−9 are shown. PC1, ATAC, and gene positions are shown. Bin size, 50 kb. Numbers at the margins indicate genomic position in megabases.
(C) TCC interaction matrix for chromosome 2 (top) and for all the chromosomes (bottom) at 100-kb resolution for naive B cells and plasma cells. The right panels indicate differential interaction matrices. Red represents enrichment of contact frequencies, whereas blue represents depletion of normalized interaction frequencies in plasma cells.
(D) GO-term bar plots for genes in 50-kb regions genome-wide that have significantly higher PC1 values in plasma cells than in naive B cells (left plot) and for genes that have lower PC1 values in plasma cells than in naive B cells (right plot).
Next, we constructed heatmaps for naive and plasma cell genomes (Figure 2C). Heatmaps representing interaction frequencies for chromosome 2 revealed a loss of long-range genomic interactions in plasma cells (Figure 2C, upper panel). The differences were particularly pronounced in differential heatmaps constructed by subtracting contact frequencies in plasma cells versus follicular B cells (Figure 2C, upper right panel). We further calculated the average contact matrices for all chromosomes and observed a de-contracted conformation (Figure 2C, lower panel).
Previous studies revealed that a wide spectrum of genomic regions switched compartments during the developmental transition from the pre-pro-B to the pro-B cell stage (Lin et al., 2012). To examine whether coding and/or regulatory DNA elements reposition during plasma cell differentiation, we compared the PC1 values associated with genomic regions derived from TCC data for naive B cells versus plasma cells. During the naive to plasma cells transition, among the most significantly changed 5% regions, 1,949 bins (50 kb) lost euchromatic strength although 517 bins gained euchromatic strength, consistent with past findings that plasma cells undergo global gene silencing (Table S1; Shaffer et al., 2002). To more precisely compare compartments in naive B cells and plasma cells, correlation difference (corrDiff) values were calculated. CorrDiff directly measures the interaction profiles of a given locus between two experiments. As corrDiff approaches 1, two regions become more similar. To determine the compartment (A or B) associated with each corrDiff value, we compared the PC1 values of corrDiff low (dissimilar) regions. This analysis revealed that, during the naive to plasma cell transition, genomic regions associated with the Prdm1 locus gained euchromatic strength, whereas regions associated with the Ebf1, Tcrb, Bcl6, and Bcl11a loci lost euchromatic character (Table S1). Additionally, an ensemble of genomic regions, including genomic regions associated with cell cycle arrest in G1, such as Cdkn2a (p16INK4) and Cdkn2b (p15INK4b), also displayed changes in compartmentalization (Table S1). To determine how changes in compartmentalization relate to function, a Gene Ontology (GO) analysis was performed. We found that a cluster of genes involved in antigen processing and presentation, lymphocyte cell fate, and DNA repair gained euchromatic strength upon differentiating from follicular B to plasma cells (Figure 2D, left panel). In contrast, the switching of genomic regions from the euchromatic to the heterochromatic compartment was predominantly associated with genes involved in cell migration and chemotaxis (Figure 2D, right panel). Taken together, these data indicate that the onset of plasma development is closely associated with global repositioning of genes from the heterochromatic to the euchromatic compartment and vice versa.
Plasma Cell Differentiation Is Concurrent with the Repositioning of Regulatory Elements
To examine how changes in compartmentalization relate to changes in gene expression, we plotted PC1 values of transcription start sites (TSSs) in naive B versus plasma cells and RNA abundance (Figure 3A). We found that a significant fraction of genomic regions that switched from compartment A to B and vice versa showed coordinate changes in transcript levels (Figure 3A). Next, we segregated genomic regions based on the correlation of HiC-derived interaction patterns between follicular B and plasma cells (Figure 3B). The majority of genomic regions that switched from the euchromatic to heterochromatic compartment showed a modest change in transcriptional silencing although genomic regions that switched from heterochromatin to euchromatin were accompanied by substantial increases in transcription levels (Figures 3B and 3C). In quantitative terms, we found that using a contingency table with changes in PC values (corrDiff 98%) and transcript abundance (absolute fold change >2) yielded chi-square test p <2.2 e–16.
Figure 3. Changes in Folding Patterns Correlate with Alterations in Gene Expression.

(A) PC1 comparison between naive B cells and plasma cells overlaying RNA-seq expression. Each spot represents a gene. PC1 values are calculated as the average PC1 of the 50-kb bins overlapping with the gene. RNA-seq change was calculated as the fold TPM change of the genes in plasma cells and naive B cells. A 5-fold TPM increase is marked as upregulated (red), and a 5-fold decrease is marked as downregulated (blue); otherwise, unchanged (gray).
(B) Change in PC1 values as it relates to the correlation difference (corrDiff). Each line represents the distribution of PC1 differences between plasma cell and naive B of the regions satisfying the criteria indicated. For example, “top 1%” denotes the regions with the top 1% lowest (most dissimilar) corrDiff values. All background means all regions in the genome were considered.
(C) Change in gene expression between plasma cells and naive B cells, shown as the ratio of the log2 of TPM, as it relates to corrDiff.
(D) Single-cell RNA-seq violin plot for Atf4, Ell2, and Prdm1. x axis shows cell type. y axis indicates UMI per million.
(E) TCC contact map for 3-Mb regions surrounding Atf4, Ell2, and Prdm1. The position of the three genes and tracks of PC1 are below. Red indicates stronger interaction, and blue indicates weaker interaction. Right-most column indicates the difference between plasma cells and follicular B cells.
To further examine how, during plasma cell differentiation, expression relates to nuclear positioning, we generated violin plots and contact maps for a selected group of genes (Figures 3D and 3E). Notably, we found that, during the transition from the follicular B to plasma cell fate, a selected group of genes, including Atf4, Ell2, and Prdm1, gained euchromatic strength (Figure 3E). The alterations in compartmentalization were closely associated with large-scale changes in chromatin folding across the Atf4, Ell2, and Prdm1 loci (Figure 3E). We next compared the TCC-derived data for these loci directly to those obtained using HiC (Johanson et al., 2018). We found that TCC and HiC showed similar patterns of interactions in both naive and plasma cells (Figures S3 and S4). Taken together, these observations indicate that the onset of plasma cell development is concomitant with large-scale changes in chromatin folding and compartmentalization across genomic regions encoding for key developmental regulators.
During the Follicular B to Plasma Cell Fate Transition, the Ebf1 and Prdm1 Loci Switch Compartments
Our earlier studies demonstrated that the Ebf1 locus is sequestered at the nuclear lamina in pre-pro-B cells but repositions away from the lamina in pro-B cells to facilitate Ebf1 gene expression (Lin et al., 2012). Because Ebf1 expression is silenced during the follicular B to plasma cell transition, we hypothesized that the Ebf1 locus would reverse compartmentalization upon commitment to the plasma cell fate (Figure S1). Surprisingly, we found that, in differentiating plasma cells, a distally located intergenic region adjacent to the Ebf1 gene body repositioned from the A to the B compartment (Figure 4A). However, this localized change in compartmentalization was closely associated with large-scale alterations in chromatin folding across the intergenic region (Figure 4A). Because plasma cell fate is orchestrated by the transcriptional regulator Prdm1, we examined whether the Prdm1 locus also repositions in differentiating plasma cells. We found that the onset of plasma cell development was associated with a significant increase in PC1 values for genomic regions located immediately upstream (yellow bar) of the Prdm1 locus which was accompanied by significantly increased strength in looping connecting the promoter regions to putative regulatory elements located upstream of the Prdm1 locus (Figure 4B). This localized change in compartmentalization was accompanied by significantly increased genomic interactions across the Prdm1 locus (Figure 4B). To validate the repositioning of the Ebf1 intergenic region, we used 3D-FISH. To mark distinct nuclear structures, we labeled three transcriptionally repressive compartments, γ-satellite DNA, the nuclear lamina, and nucleoli (Kieffer-Kwon et al., 2013; Bunting et al., 2016; Figure 5A). Nucleoli were labeled using an antibody directed against nucleophosmin (NPM) (Figure 5A). As expected, we found that the development of plasma cells was closely associated with large-scale changes in nucleolar topology (Figure 5A). Notably, rather than returning to the nuclear lamina in plasma cells, the Ebf1 locus relocated toward heterochromatic-regions-associated γ-satellite DNA and nucleoli (Figures 5A and 5B). These data indicate that the Ebf1 locus repositions to peri-centromeric heterochromatin plausibly to permit developmental progression from the follicular B to plasma cell fate. To test the possibility that Ebf1 expression acts to enforce the follicular B cell state, we overexpressed Ebf1 in activated B cells. Specifically, we transduced activated follicular B cells that were derived from Prdm1-GFP mice. We measured plasma cell differentiation by Prdm1-GFP expression 48 h after infection. We found that Ebf1 overexpression interfered with plasma cell differentiation, decreasing the fraction of Prdm1+ cells by half in 3-day cultures without interfering with cell cycle progression (Figure 5C). Taken together, these data indicate that modulation of Ebf1 and Prdm1 expression during plasma cell development is concomitant with changes in compartmentalization
Figure 4. Plasma Cell Fate Is Associated with Large-Scale Changes in Chromatin Folding across the Ebf1 and Bcl6 Loci.

(A) Contact map for chromosome 11 from 43 to 46 Mb at 50-kb resolution. Gene tracks are from Refseq. Sushi plot shows the interaction between Ebf1 promoter and the ATAC peaks in target region. Integrative Genomics Viewer (IGV) tracks of ATAC-seq and location of Ebf1 DNA-FISH probes (green) for naive B cells (left) or plasma cells (right) are shown.
(B) Contact map for chromosome 10 from 43 to 46 Mb at 100-kb resolution. Gene tracks are from Refseq. Sushi plot shows the interactions between Prdm1 genomic region and the ATAC peaks in target region. IGV tracks of ATAC-seq for follicular B cells (left) or plasma cells (right) are shown.
Figure 5. The Ebf1 Locus Repositions from the Nuclear Interior to the Transcriptionally Repressive Compartment.

(A) Example images from immunofluorescence for Ɣ-satellite (green) combined with DNA-FISH for the Ebf1 locus (red, top panel). Example images from immunofluorescence for LaminB1 (red) combined with DNA-FISH for the Ebf1 locus (green, middle panel) are shown. Example images from immunofluorescence for NPM (red) combined with DNA-FISH for the Ebf1 locus (green, bottom panel) are shown. Ɣ-satellite was used to label peri-nucleolar heterochromatin (“chromocenters”), LaminB1 was used to label lamin, NPM foci were used to demarcate nucleoli (red), and DAPI was used to demarcate nuclear DNA (blue).
(B) Dot plots for distance between Ebf1 locus and Ɣ-satellite, LaminB1, and NPM foci.
(C) Representative flow plots of uninfected, empty vector, and EBF1-overexpressing activated B cells 48 h after infection.
Plasma Cell Fate Is Enriched at Inter-chromosomal Hubs
The data described above using RNA-FISH indicate that Xbp1, Atf4, and Prdm1 transcripts are located within close spatial proximity in a significant fraction of plasma cells (Figures 1D and S5A). We also found that, in plasma cells versus follicular B cells, inter-chromosomal TCC reads were enriched for genomic regions that span the Prdm1, Xbp1, and Atf4 loci (Figure S5B). These observations raise the possibility that inter-chromosomal associations are enriched for genes encoding for proteins associated with the plasma cell fate. To explore this possibility in more detail, we plotted the relative frequencies for inter-chromosomal associations for 1 Mb genomic regions as 2D cloud plots. For both follicular B and plasma cells, genomic regions enriched for inter-chromosomal association frequencies readily segregated into either compartment A or B (Figure S5C, left and middle panels). Notably, we found that Xbp1 and Atf4, two genes encoding for proteins involved in the UPR pathway, clustered in the inter-chromosomal association cloud within the euchromatic region (PC1 > 0) in both naive B and plasma cells (Figure S5C, right panel). In contrast, the Prdm1 locus showed fewer significant interactions with the Xbp1 and Atf4 loci, whereas in plasma cells, the Prdm1 genomic region was enriched for genomic associations involving genes encoding for key components of the UPR, including the Xbp1 and Atf4 loci (Figure S5C, right panel). To determine whether inter-chromosomal associations are concomitant with gene expression patterns, we generated correlation matrices for clusters of genes associated with a B-lineage-specific gene program (green) and genes involved in ribosome biogenesis (gray; Figure 6A, left panel). For comparison, randomly chosen genes (not marked) were included in the analysis (Figure 6A). To identify inter-chromosomal hubs, genes were grouped as even- or odd- associated chromosomes (Figure 6A, right panel). Both B-lineage and ribosome-associated gene clusters displayed expression patterns that correlated within the cluster (gray to gray or green to green) but were anti-correlated between the two clusters (gray to green; Figure 6A). As expected, randomly chosen genes were not correlated (Figure 6A). To compare correlated expression patterns to inter-chromosomal associations, we generated a second matrix assembled for the same clusters of genes (Figure 6A). Notably, we found that enrichment for inter-chromosomal interactions was associated with either coordinate or mutually exclusive patterns of gene expression (Figure 6A).
Figure 6. Coordinated Patterns of Gene Expression Correlate with Inter-chromosomal Associations.

(A) Heatmap for the transcriptional correlation between selected genes on different chromosomes in naive B cells (left). Red indicates positive transcriptional correlation, blue indicates negative transcriptional correlation, and white marks no transcriptional correlation. Heatmap for the inter-chromosomal TCC read number (right) is shown. The intensity of green indicates the number of TCC reads with dark green equal to more reads. 1-Mb bins centered on the TSS of each gene were used to derive the TCC matrix. The ordering of rows and columns is the same for both plots.
(B) Cartoon outlines how correlation analysis was done. The two matrices on the left are examples of TCC matrix and scRNA correlation matrix. We first selected all paired 1-Mb inter-chromosomal regions that showed enriched TCC reads. We next plotted the distribution of corresponding gene expression correlation as gray lines (right panel). Please note that if TCC reads coordinate with gene expression correlation, then the red and grey lines are expected to differ (right panel). Then, we selected all the inter-chromosomal region pairs that have depleted TCC reads and plotted the distribution of corresponding gene expression correlation as gray line on the right. If TCC reads are correlated with gene expression correlation, then the red and gray lines will significantly separate from each other as shown on the right.
(C) Distribution of scRNA correlation between inter-chromosomal region pairs. Each line indicates a subset of region pairs of specific normalized TCC read number.
To determine whether global gene expression patterns correlated with genome-wide inter-chromosomal associations, we generated scRNA-seq correlation matrices for follicular B and plasma cells. HiC matrices were generated at 1 Mb resolution along the same line. To construct scRNA-seq correlation matrices, we analyzed all genes that span a 1-Mb region for all chromosomes and computed the maximum correlation coefficients for each bin (Figure 6B). For example, for genomic regions A and B, we designated all the genes in region A as gene set GA and all the genes in region B as gene set GB. Next, we defined the correlation coefficients for all possible pairwise correlations between GA and GB and selected the highest absolute values as the scRNA correlation for genomic regions A and B. We repeated this process for all possible pairs and constructed a scRNA-seq correlation matrix (Figure 6B). We then divided paired genomic regions into two categories (high and low) based on HiC reads. For each category, we plotted the distribution of scRNA-seq correlation coefficients. We predicted that, if scRNA-seq correlation coefficients were correlated with HiC intensity, a shift in the distribution would readily be observed when plotted as a function of normalized HiC reads (Figure 6B, right panel). We then applied this approach to the follicular B and plasma cell datasets. Based on normalized read numbers, we categorized pairing into five groups. For both follicular B and plasma cells, we found that inter-chromosomal read numbers were concurrent with scRNA-seq correlation coefficients (Figure 6C). As TCC reads increased between paired genomic regions, scRNA correlation coefficients either positively or negatively became more significant. This bimodal pattern suggests that inter-chromosomal hubs not only promote coordinate patterns of gene expression but also facilitate coordinate transcriptional repression. Gene pairs of interest in plasma cells include Id3-Atf4, Prdm1-Xbp1, Pax5-Xbp1, and Tcf3-Xbp1 (Table S2). Taken together, these data indicate that inter-chromosomal proximity correlates with coordinate follicular B and plasma cell gene expression patterns.
Identification of Epigenetic Marks at Inter-chromosomal Hubs
To determine whether and how inter-chromosomal associations relate to the deposition of histone marks, we first defined significant interactions using HiC. We used 1-Mb bins as normalized HiC value >1. Among 1,537,272 possible inter-chromosomal 1-Mb bin pairs, 30,661 pairs revealed normalized HiC values >1, i.e., 2% of all bin pairs. Paired genes that were expressed and positioned at inter-chromosomal hubs spanning 1 Mb were identified. We next centered our analysis on genomic regions that span different genomic distances (1, 4, 10, 40, and 100 kbp) that flank the TSSs of inter-chromosomally associating genes identified in the HiC analysis. Positively correlated genes were defined as cor(gene A, gene B) > 0.4 and negatively correlated genes as cor(gene A, gene B) <0.4. We found that based on these criteria, only 0.2% inter-chromosomal gene pairs displayed coordinate patterns of gene expression. We then built a random forest model to identify histone marks for paired genes that showed significant inter-chromosomal associations. Thirty-six histone marks were examined for this analysis (Kieffer-Kwon et al., 2017). For each histone mark, we utilized the “sum” and the “absolute delta” of the histone mark score for the two genes (Figure 7A). To test the accuracy of the model, we randomly sampled 1,500 gene pairs that were not presented to the model during training. Specifically, as it relates to gene expression, 500 positively correlated, 500 negatively correlated, and 500 no correlation gene pairs were selected (Figure 7B). We found that the model accurately identified 68.3% of the gene pairs (Figure 7B). We then asked the model to reveal histone marks important for predicting correlated gene expression for inter-chromosomally hubs (Figure 7C). We found that, at inter-chromosomal hubs, H3K27Ac was linked with a relatively high probability of positive correlated transcription, although high intensity of histone mark H3K18Ac and H3K14Ac was linked either with non-correlated or negatively correlated patterns of gene expression (Figure 7C). These data indicate that distinct histone marks are associated with inter-chromosomal assemblies that function either as transcriptionally permissive or transcriptionally repressive hubs.
Figure 7. Identification of Epigenetic Marks Enriched Inter-chromosomal Hubs.

(A) Strategy to identify histone marks enriched at inter-chromosomal hubs. Significant inter-chromosomal genomic interactions were identified using HiC. Next, coordinately expressed genes that were enriched for inter-chromosomal interactions were identified. Genes that showed enrichment for histone marks at inter-chromosomal hubs were identified using machine learning.
(B) Predicted and observed correlated patterns for histone deposition at inter-chromosomal hubs for naive B cells are indicated.
(C) Distinct histone marks are enriched at transcription hubs at naive B cells. The histone mark H3K27Ac is enriched at inter-chromosomal sites associated with coordinate gene expression. In contrast, the deposition of H3K27me3 and H3K14Ac was negatively correlated with transcription at paired inter-chromosomally associating loci.
DISCUSSION
Previous studies have documented that the onset of B cell development is associated with large-scale changes in chromatin topology (Johanson et al., 2018; Lin et al., 2012). Here, we find that the establishment of plasma cell identity is associated with a plethora of structural alterations. Prominent is a significant decline in genomic interactions that span vast genomic distances. Extensive long-range genome remodeling has previously been associated with cell cycle progression contraction (Nagano et al., 2017). It is unlikely, however, that the decline in remote genomic interactions at the onset of plasma cell development is caused by differences in cell cycle, given that both follicular B and plasma cells are non-cycling (Tourigny et al., 2002). More likely, such elaborate alterations in chromosome topology are instructed by plasma cell physiology, plausibly to facilitate the positioning of genes associated with antibody production within close proximity of the expanded endoplasmic reticulum (Park et al., 2014). Alternatively, the changes in chromatin topology may simply reflect enhancer-induced changes in chromatin folding as recently described for activated macrophages and neutrophils (Cuartero et al., 2018; Denholtz et al., 2020).
Numerous studies revealed that the immunoglobulin heavy chain (Igh) and Igk loci undergo large-scale locus contraction upon adopting the pro-B cell fate (Jhunjhunwala et al., 2009). Igh locus contraction, in part, is mediated by the paired homeodomain protein Pax5 while Igk locus condensation is orchestrated by the E2A proteins (Ebert et al., 2011; Lin et al., 2011; Murre, 2019). Recent compelling studies demonstrated that Pax5 plays a key role in orchestrating B cell nuclear architecture (Johanson et al., 2018). We would like to suggest that the induction of large-scale genome de-contraction in differentiating plasma cells is orchestrated by a decline in Ebf1 and Pax5 expression versus an increase in Prdm1, E2A, and E2–2 expression. How would these factors regulate long-range chromatin structure? Recent studies have indicated that elevated abundance of H3K27Ac recruit members of the cohesin machinery at super-enhancers to orchestrate long-range genomic interactions (Denholtz et al., 2020). We suggest that, likewise, the onset of plasma cell development is orchestrated by transcription-factor-induced changes in H3K27Ac abundance at enhancers to modulate loop extrusion and chromatin folding.
In addition to large-scale genome de-contraction, plasma cell fate is also accompanied by large-scale repositioning of intergenic regions. Notably, we found that genes encoding for factors that dictate germinal center versus plasma cell fate gain euchromatic strength in differentiating plasma cell progenitors, although the euchromatic character of genes encoding for key developmental regulators that are transcriptionally silenced, including the Ebf1 locus, declines upon exiting the follicular B cell compartment. Although, during the pre-pro-B to pro-B cell transition, the EBf1 locus relocates from the lamina to the nuclear interior in developing plasma cell progenitors, the Ebf1 locus associates with peri-centromeric heterochromatin rather than returning to the lamina. The repositioning of genes to the peri-centromeric regions is not unique to the Ebf1 locus. Previous studies demonstrated that the Tcrb and Igk loci reposition to the peri-centromeric regions during the process of variable-diversity-joining (VDJ) rearrangement, and hence, it may involve a common mechanism that underpins transcriptional silencing in maturing B cells (Goldmit et al., 2005; Chan et al., 2013). It will be of interest to determine how genes reposition to the peri-centromeric chromatin. We speculate that this process will involve loop extrusion in a manner similar as described for the repositioning of the Bcl11b locus from the lamina to the nuclear interior (Isoda et al., 2017; Hu et al., 2018).
In addition to changes in compartmentalization, we found that, at the onset of plasma cell development, genomic regions encoding for key developmental regulators, including Prdm1, Xbp1, and Atf4 loci, assemble in inter-chromosomal transcription hubs in a fraction of developing plasma cells. The intermingling of genes dispersed across different chromosomes is not unique to plasma cells. Prominent among them is the nucleolus, an interaction hub for actively transcribing rRNA genes (McStay, 2016; Li et al., 2018). Likewise, in order to coordinate gene expression the olfactory receptor genes share inter-chromosomal hubs (Lomvardas et al., 2006; Monahan et al., 2017). Here, we have a new approach to determine how inter-chromosomal interaction hubs are assembled. We found that the deposition of an ensemble of histone marks, including H3K27Ac and H3K27me3, were enriched at inter-chromosomal hubs. The deposition of the super-enhancer mark H3K27Ac was enriched at inter-chromosomal assemblies associated with transcriptionally active regions, although histone marks associated with transcriptional repression, including H3K27me3, were enriched at transcriptionally silenced hubs. This then raises the question as to whether and how histone marks play a regulatory and/or structural function at inter-chromosomal hubs. We speculate that the deposition of H3K27Ac or H3K27me3 orchestrates the assembly of phase-separated droplets, as proposed for super-enhancers, to facilitate inter-chromosomal interactions (Brangwynne et al., 2009, 2011; Khanna et al., 2019).
In conclusion, we demonstrate that plasma cell fate is closely associated with elaborate changes in chromatin folding involving genes that encode for transcriptional regulators that activate a plasma-cell-specific gene program. We found that these changes included alterations in nuclear location and in inter-chromosomal interactions. Finally, we found that inter-chromosomal hubs in maturing B cells were significantly enriched for the deposition of either H3K27Ac or H3K27me3 and propose that the deposition of these marks facilitate inter-chromosomal interactions to orchestrate coordinate patterns of gene expression.
STAR★METHODS
LEAD CONTACT AND MATERIALS AVAILABILITY
Further information and requests for resources and reagents should be directed to and will be fulfilled by the Lead Contact, Cornelis Murre (cmurre@ucsd.edu). All unique/stable reagents generated in this study are available from the Lead Contact with a completed Materials Transfer Agreement. Commercially available reagents are indicated in the Key Resources Table.
KEY RESOURCES TABLE
| REAGENT or RESOURCE | SOURCE | IDENTIFIER |
|---|---|---|
|
| ||
| Antibodies | ||
|
| ||
| CD4-PE Cy5 (RM4–5) | eBioscience | Cat# 15–0041-82, RRID: AB_468695 |
| CD8a-PE Cy5 (53–6.7) | eBioscience | Cat# 15–0081-81, RRID: AB_468705 |
| Gr-1-PE Cy5 (RB6–8C5) | Biolegend | Cat# 108409, RRID: AB_313374 |
| Ter119-PE Cy5 | Biolegend | Cat# 116210, RRID: AB_313711 |
| F4/80-PE Cy5 (BM8) | eBioscience | Cat# 15–4801-82, RRID: AB_468798 |
| IgD-APC (11–26) | eBioscience | Cat# 17–5993-82, RRID: AB_10598660 |
| B220-PECF594 (RA3–6B2) | eBioscience | Cat# 562290, RRID: AB_11151901 |
| CD138-PE (281–2) | eBioscience | Cat# 553714, RRID: AB_395000 |
| CD19-AF700 (1D3) | eBioscience | Cat# 56–0193-80, RRID: AB_837082 |
| CD23-biotin (B3B4) | eBioscience | Cat# 13–0232-81, RRID: AB_466392 |
| B23 (1/150, FC82291) | Abcam | Cat# ab10530, RRID: AB_297271 |
| Lamin B (1/150, M-20) | Santa Cruz Biotechnology | Cat# sc-6217, RRID: AB_648158 |
| goat anti-mouse IgG1 Alexa Fluor 568 (1/50) | Life Technologies | Cat# A21124, RRID: AB_2535766 |
| donkey anti-goat IgG (H+L) Alexa Fluor 594 (1/25) | Life Technologies | Cat# A11058, RRID: AB_2534105 |
|
| ||
| Chemicals, Peptides, and Recombinant Proteins | ||
|
| ||
| anti-biotin microbeads | Miltenyi Biotec | Cat# 130–090-485 |
| MACs LS columns | Miltenyi | Cat# 130–042-401 |
| LPS (Escherichia coli) | Sigma-Aldrich | Cat# L2654 |
| DAPI | Invitrogen | Cat# D1306 |
| ChromaTide Alexa Fluor 488–5-dUTP | Invitrogen | Cat# C11397 |
| ChromaTide Alexa Fluor 568–5-dUTP | Invitrogen | Cat# C11399 |
| Alexa Fluor 647-aha-dUTP | Invitrogen | Cat# A32763 |
| EZ-Link Iodoacetyl-PEG2-Biotin | Thermo Scientific | Cat# 21334 |
| Mbo1 | NEB | Cat# R0147S |
| MyOne Streptavidin C1 beads | Invitrogen | Cat# 65001 |
| SYBR Gold Nucleic Acid Gel Stain | Invitrogen | Cat# S11494 |
| TURBO DNase | Invitrogen | Cat# AM2238 |
|
| ||
| Critical Commercial Assays | ||
|
| ||
| CellTrace Violet Cell Proliferation Kit | Invitrogen | Cat# C34557 |
| DNA Clean & Concentrator Kits | Zymo Research | Cat# D4033 |
| NEBNext® High-Fidelity 2X PCR Master Mix | NEB | Cat# M0541L |
| Dynabeads mRNA purification kit | Invitrogen | Cat# 61006 |
| SuperScript III First-Strand Synthesis System | Invitrogen | Cat# 18080051 |
| Chromium Single Cell 3’ Library & Gel Bead Kit v2 | 10x Genomics | Cat# 120237 |
|
| ||
| Deposited Data | ||
|
| ||
| Raw and analyzed scRNA-seq data | This paper | GEO: GSE139565 |
| RNA-seq data, TCC data and ATAC-seq data | This paper | GEO: GSE113014 |
| In situ HiC data | Kieffer-Kwon et al., 2017 | GEO: GSE82144 |
|
| ||
| Experimental Models: Organisms/Strains | ||
|
| ||
| Mouse: C57BL/6 | Jackson | Cat# 000664 |
| Mouse: C57BL/6 Blimp+/GFP | Obtained from Dr. Nutt (WEHI, Australia) | N/A |
|
| ||
| Cell Cultures | ||
|
| ||
| Primary B cell cultures derived from male/female Blimp-GFP mice | Obtained from Dr. Nutt (WEHI, Australia) | N/A |
|
| ||
| Recombinant DNA | ||
|
| ||
| bacterial artificial chromosome (BAC) probe RP23–118P17 | BACPAC Resource Center (BPRC) at Children’s Hospital Oakland Research Institute | RP23–118P17 |
| bacterial artificial chromosome (BAC) probe WIBR1–0109P11 | BACPAC Resource Center (BPRC) at Children’s Hospital Oakland Research Institute | WIBR1–0109P11 |
| bacterial artificial chromosome (BAC) probe WIBR1–0350 | BACPAC Resource Center (BPRC) at Children’s Hospital Oakland Research Institute | WIBR1–0350 |
|
| ||
| Software and Algorithms | ||
|
| ||
| BD FACS DIVA Version 8.0.2 | BD Biosciences | https://www.bdbiosciences.com/en-us/instruments/research-instruments/research-software/flow-cytometry-acquisition/facsdiva-software |
| SoftWoRx Version 5.0 | GE Healthcare | http://incelldownload.gehealthcare.com/bin/download_data/SoftWoRx/7.0.0/SoftWoRx.htm |
| Cellranger Version 2.1.0 | 10X Genomics | https://support.10xgenomics.com/single-cell-gene-expression/software/pipelines/latest/what-is-cell-ranger |
| Flow Jo Version 10.5.0 | Treestar, Inc. | https://www.flowjo.com |
| FIJI plugin Tools for Analysis of Nuclear Genome Organization (TANGO) version 0.94 | TANGO | https://biophysique.mnhn.fr/tango/Install |
| Rtsne | van der Maaten and Hinton, 2008 | https://cran.r-project.org/web/packages/Rtsne/index.html |
| Seurat | Butler et al., 2018 | https://satijalab.org/seurat/ |
EXPERIMENTAL MODEL AND SUBJECT DETAILS
Strains
Adult C57BL/6 mice were purchased from Jackson Laboratories and maintained in a specific pathogen-free facility at the University of California, San Diego. Blimp+/GFP mice were obtained from Dr. Nutt (WEHI, Australia). Mice were analyzed between 4–12 weeks of age. Both male and female mice were used for analysis. Animal studies (Protocol Number: S00031) were approved by The Institutional Animal Care and Use Committee (IACUC).
Ethics Statement
Animal experiments were completed in adherence to conditions approved by the UCSD IACUC.
METHOD DETAILS
Flow cytometry
Single-cell suspensions of splenocytes were prepared, depleted of red blood cells by hypotonic lysis, and stained with optimal dilutions of the indicated antibodies. All of the following reagents were obtained from eBioscience: anti-CD4 (RM4–5), anti-CD8a (53–6.7), anti-Gr-1 (RB6–8C5), anti-F4/80 (BM8), and anti-TER119; anti-IgD (11–26); anti-B220 (RA3–6B2); anti-CD19 (1D3). Doublets were excluded using the combined width and height parameters of the forward and side scatter parameters. Flow cytometric acquisition was performed on a BD LSRII, and analyses were performed using FlowJo 10.1r5 (Tree Star). Cells were sorted with a three-laser FACsAria Fusion.
Cell culture
Splenocytes were incubated with CD23-biotin (eBioscience, clone B3B4, cat. 13–0232-81) and purified using anti-biotin microbeads (Miltenyi Biotec, cat. 130–090-485) on MACs LS columns. Sorted B cells were cultured for 3 days in RPMI 1640 medium supplemented with 10% FCS, antibiotics, 2mM L-glutamine, and β–mercaptoethanol (50 μM) at 37C, 5% CO2, before analysis by flow cytometry. LPS (Escherichia coli) was purchased from Sigma-Aldrich; L2654–1MG and used at 10 μg/mL. For cell division experiments, cells were labeled with CellTrace Violet reagent (Invitrogen, Molecular Probes). Dead cells were excluded using DAPI (Invitrogen, Molecular Probes).
DNA-FISH
Cells were placed on poly-L-lysine coated coverslips for 30 minutes in 37°C incubator. fixed with paraformaldehyde at the final concentration of 4% for 10 minutes. The 200 kb bacterial artificial chromosome (BAC) probe RP23–118P17 and 40 kb fosmids was obtained from the BACPAC Resource Center (BPRC) at Children’s Hospital Oakland Research Institute. Probes were labeled by nick translation using Alexa 488 dUTP, Alexa-568 dUTP, or Alexa-647 dUTP (Invitrogen). Incubated overnight at 37°C. The following morning, coverslips were washed twice in 50% formamide/2x SSC at 37°C for 30 minutes on a shaking incubator at 300 rpm. Coverslips were then rinsed in 1x PBS containing DAPI. Coverslips were rinsed once more with 1x PBS.
Immunofluorescence
Coverslips were permeabilized with 0.1% saponin/0.1% Triton-X in PBS at room temperature for 10 minutes, then incubated for 20 minutes at room temperature with 20% glycerol in 1x PBS. Slides were submerged in liquid nitrogen three times, rinsed once with 1x PBS, and then blocked for 30 minutes with 5% BSA/0.1% Triton-X in 1x PBS for 30 minutes at 37°C. The nucleolus was stained first with primary antibodies to B23 (Abcam) for 30 minutes in a humidified chamber at 37°C. Coverslips were washed twice, 10 minutes each, in 0.1% Triton-X in 1x PBS at room temperate on a shaker at 70 rpm. Secondary staining with performed using donkey antibody to mouse IgG conjugated to Alexa-568 (Invitrogen) for 30 minutes at 37°C in 5% BSA/0.1% Triton-X and 5% serum in 1x PBS. Coverslips were washed twice for 10 minutes each in 1x PBS/0.1% Triton-X at room temperature with gentle agitation (70 rpm). The nuclear lamina was stained first with primary antibody to Lamin B1 (sc-6217; Santa Cruz Biotechnology), followed by secondary staining.
Single molecule RNA-FISH
Pools of fluorescently labeled oligonucleotide probes per RNA were designed and purchased from LGC Biosearch Technologies using the Stellaris Probe Designer. For intronic Prdm1 and Xbp1, default settings were used. For intronic Atf4, masking level was set to 3, oligo length was set to 18, and nucleotide spacing was set to 1. Cells were fixed and permeabilized as described for DNA-FISH, but were stored overnight at 4C in 70% ethanol rather than PBS. The next day, coverslips were rinsed in wash buffer (10% formamide in 2x SSC) to remove ethanol, then incubated in wash buffer for 5 minutes at room temperature. Coverslips were incubated with probe of interest in hybridization buffer overnight in a 37C humidified hybridization oven. The next morning, coverslips were rinsed in washed buffer and washed twice for 30 minutes each in 37°C temperature-controller shaker at 100 rpm. During the second wash, DAPI was added to the wash buffer. Slides were rinsed once in 2x SSC, once in 1x PBS, and then mounted with Prolong Gold Anti-Fade reagent. Slides were dried in the dark for at least 6 hours prior to sealing with nail polish and imaging.
Imaging
Three-dimensional fluorescent images were acquired using an Applied Precision Inverted Deconvolution Deltavision Microscope with a 100x objective (Nikon 100x/1.40 oil or Olympus 100x/1.4 oil). Optical sections (z stacks) 0.2μm apart were obtained throughout the cell volume in the DAPI, FITC, Red, and Cy5 channels. Deconvolution was performed using Softworx Software version 5.0 with the following settings: 10 cycles of enhanced ratio (aggressive), camera intensity offset = 50, normalize intensity and apply correction options selected.
Spatial distance measurements
The nuclei of individual cells were identified by DAPI staining, and cells containing two spots per DNA-FISH or intronic RNA-FISH channel were verified manually. Images were cropped to contain single cells. Analysis of cells in three dimensions was performed using the FIJI plugin Tools for Analysis of Nuclear Genome Organization (TANGO) version 0.94. Distance between two DNA-FISH spots was calculated after segmentation in TANGO by running the “Distance” measurement between center-of-mass of the two loci. Distance between nuclear structures and a DNA-FISH spot was calculated as the minimum distance between the center-of-mass of the DNA-FISH spot to the edge of the corresponding structure. Negative values indicate inclusion of the FISH spot in the nuclear structure.
Overexpression of EBF1 in activated B cells
The GFP cassette of the LMP vector was replaced with hCD25 cassette for EBF1 overexpression. Retroviral supernatant was obtained through 293T transfection by the calcium phosphate method with these constructs in conjunction with the packaging plasmid pCL-Eco. CD23+ cells were MACs selected and stimulated in vitro for 48 hours prior to infection. Cells were harvested 48 hours after infection for analysis by flow cytometry.
Tethered Chromatin Capture (TCC) sample preparation
TCC was performed as previously described (Kalhor et. al., 2011) using 5 million naive B cells or sorted plasma cells with the following modifications.
Cell lysis and chromatin biotinylation
Cell suspensions were not treated with a Dounce homogenizer. After washing, cells were resuspended in 500 μL of wash buffer and mixed with 190 μL of 2% SDS and incubated at 65C for 10 minutes to solubilize the crosslinked chromatin. Nuclei were spun at RT at 3500 rpm for 2 minutes. Supernatant was discarded and nuclei were resuspended in 245 μL wash buffer. Once the suspension cooled to RT, it was mixed with 105 μL of 25 mM EZlink Iodoacetyl-PEG2-Biotin (IPB) (Thermo Scientific) and rocked at RT for 75 minutes to biotinylate the cysteine residues. The sample was then mixed with 650 ul of 1xNEBuffer2 and incubated on ice for 5 minutes.
Digestion and dialysis
To start digestion, 85 μL of NEBuffer2, 3 μL 1M DTT, 227 μL H2O, and 35 μL of 25 U/μl Mbo1 (NEB) were incubated O/N at 37C.
Removal of biotin from non-ligated DNA ends and shearing
To shear DNA fragments, the sample size was adjusted to 120 ul by adding water. The sample was transferred to a 6x16mm AFA fiber microtube with snap-cap and sheared to 100–500bp in a Covaris E220 S2 (Biogem) at duty cycle of 5%, intensity of 5 ( = 175W in E220), 200 cycles/burst, for a total of 180 s.
Pull-down of biointinylated DNA and ligation of sequencing adaptors
15 ul of MyOne Streptavidin C1 beads (Invitrogen) were used. After washing beads with TE, reaction was resuspended in 30 ul of 0.033% Tween20/TE.
PCR amplification
Libraries were amplified using Phusion HotStart II for experimentally determined numbers of PCR cycles with the following program: 98°C /30 s, x-cycles [98°C/10 s, 65°C for 30 s, 72°C for 20 s], 72°C for 5 minutes
Size selection
The entire PCR product was loaded onto a polyacrylamide gel and run at 200V for 70 minutes. The gel was stained with SybrGold (Invitrogen) and visualized on Gel Doc 1000. Fragments between 300 and 600 bp were excised and purified by spinning the gel through a homemade shredder for 5 minutes at 14,000 rpm at RT. DNA was extracted by incubated sample in 400 ul EB (QIAGEN) O/N at 37C shaking at 1400rpm. DNA was ethanol precipitated.
Sequencing
DNA was paired-end sequenced with Illumina HiSeq 2000.
RNA sequencing
A total of 10,000–100,000 B cell subsets were sorted into Buffer RLT (QIAGEN) and RNA was isolated. Total RNA was isolated using RNeasy Mini kit (QIAGEN) with on column DNase treatment. RNA was again treated with TURBO DNase (Life Technologies) and mRNA was purified with Dynabeads mRNA purification kit (Life Technologies). First-strand synthesis kit (Life Technologies) in presence of actinomycin D using a combination of random hexamers and oligo(dT). Second-strand synthesis was performed with dUTP instead of dTTP. The ds-cDNA was sonicated to 150–400 bp using the Covaris sonicator. Sonicated cDNA was ligated to adaptors. The resulting DNA was treated with uracil-N-glycosylase prior to PCR amplification with the indexing primers. Following PCR, fragments were size-selected and sequenced on HiSeq 2500.
ATAC sequencing
ATAC-seq was performed as previously described (Buenrostro et al., 2013). 50,000 cells were used for library preparation. Cells were treated with transposition mix for 30 minutes at 37°C. DNA was purified with DNA Clean & Concentrator (Zymo Research). Library fragments were amplified by PCR using 1x NEBnext PCR master mix (NEB) and 1.25 uM of custom Nextera PCR primers 1 and 2 as follows: 72°C for 5 min., 98°C for 30 s, 98°C for 10 s, 63°C for 30 s and 72°C for 1 minute. Amplified libraries were selected using SPRI beads. The quality of the library was measured using Agilent TapeStation and the final product was sequenced on an Illumina HiSeq 4000. Reads were mapped to mouse genome build mm9 using TopHat and converted to track plots by IGV.
Single cell RNA sequencing
Approximately 10,000 cells per sample were loaded into Single Cell A chips (10X Genomics) and partitioned into Gel Bead In-Emulsions (GEMs) in a Chromium Controller (10X Genomics). Single cell RNA libraries were prepared according to the 10x Genomics Chromium Single Cell 3′ Reagent Kits v2 User Guide, and sequenced on a HiSeq 4000.
QUANTIFICATION AND STATISTICAL ANALYSIS
Statistical test utilization and p value reporting are presented in the text, figures, and legends.
Analysis of TCC data
TCC reads were mapped by bowtie and processed by HOMER to create tag directory with default setting. Read numbers of naive and plasma cells were down-sampled by HOMER, using getRandomReads.pl by reducing the total number of reads to match the smaller sample size (naive B cells). Inter-chromosomal associations were called by HOMER using 1 Mb bins and a threshold p = 10−4 with the other options set as default. Intra-chromosomal interactions were called by HOMER using 25 kb and 50 kb bins, threshold p = 10−4 and max distance 3 Mb with the other options set as default. PC1 and corrDiff were calculated by HOMER with 50 kb resolutions. TCC matrices, normalized or raw, were generated by HOMER with default settings using 1 Mb bins for the whole genome and 50 kb bins for individual chromosomes. The raw matrices were normalized by KR-normalization (Rao et al., 2014).
Compartments
To quantify switched domains, the following criteria were used: regions with PC1 change more than 25, regardless of sign, were considered switched. Bin size was 50 kb. Consecutive regions were merged. Two regions separated by only one bin that did not pass threshold were also merged.
corrDiff
Corrdiff scores were calculated by directly correlating the interaction profile of a locus in one experiment to the interaction profile of that same locus in another experiment. For example, given two HiC matrices A and B derived from two conditions, we computed the correlation of the interaction profile of the ith bin between the two conditions followed by cor(A[i,-i],B[i,-i]) in R. Table S1 was generated by the 5% 50 kb bins that have lowest corrDiff value.
Table S1 was generated by the 5% 50 kb bins that have lowest corrDiff value.
Average intra-chromosomal contact maps
The average intra-chromosomal TCC contact maps for naive B cells and plasma cells (Figure 2) were generated as follows: 1) calculate the 100 kb resolution raw TCC contact maps for each chromosome (chr1–19 and X, in total 20 matrices); 2) resize each contact matrix to have 100 rows and 100 columns; and, 3) calculate the average contact intensity of all chromosomes.
Analysis of bulk RNA-seq
Single-end sequencing reads were mapped to mouse genome build mm9 using TopHat and analyzed using the Cufflink-cuffdiff pipeline. Transcript quantification was performed using Kallisto with default settings. TPM was used in cross-sample comparison. Fold change was computed by calculating fold changes between TPM+1.
Analysis of scRNA-seq
Reads from single-cell RNA-seq were aligned to mm10 and collapsed into unique molecular identifier (UMI) counts using the 10X Genomics Cell Ranger software (version 2.1.0). Raw cell-reads were then loaded to R using the cellrangerRkit package. The scRNA-seq dataset was then further filtered based on gene numbers and mitochondria gene counts to total counts ratio. Only cells with > 300 genes UMI > 0, and 0.05% ~10% of their UMIs mapping to mitochondria genes were kept for downstream analysis. If a sample have more than 2000 cells detected, then only 2000 cells were randomly selected to downstream analysis. Such sampling guaranteed the cell number from each sample were relatively balanced. Only genes that had UMI > 0 in more than 2% of cells of at least one sample were kept for downstream analysis. UMI counts were transformed to UMI per million (UPM) for downstream analysis. To fix the drop-out issue of single cell RNA-seq, we calculated average expression for every 20 neighboring cells for downstream analysis except for TSNE and differential expression analysis. The corrected UPM matched much better with the RNA-FISH (Figures 1C–1E) than the raw UPM. Differential expression analysis was done based on the original UPM because Wilcox test was used which would not be biased by the drop-out issue. DE gene threshold was set to Bonferroni corrected q-value < 0.05 and (UPM+1) fold change > 2.
Correlation analysis between HiC and scRNA-seq
ScRNA correlation and TCC/HiC matrices at 1Mb resolution were used for the correlation analysis. To construct a scRNA correlation matrix we analyzed all genes within the 1 Mb region across all chromosomes and computed the maximum correlation of gene expression for each bin. For example, for genomic regions A and B we designated all the genes in region A as gene set GA and all the genes in region B as gene set GB. Next, we defined the correlation for all possible pairwise correlations between GA and GB and selected the highest absolute value as the scRNA correlation for A and B genomic regions. We repeated this process for all possible pairs and constructed a scRNA correlation matrix. This method filtered out most of noise introduced by genes that were not expressed and that were expressed independent of any other genes. For TCC/HiC matrix, KR normalized was applied with sparse limit set to 0.95. For all matrices, only bins in even chromosome were kept in rows and only bins in odd chromosome were kept in column, thus only interchromosomal part of the original matrix was considered. We then divided paired genomic regions into multiple categories based on HiC reads intensity. For each category, we plotted the distribution of scRNA correlation coefficients for the region-pairs. If scRNA correlation coefficients were correlated with HiC intensity a shift in the distribution would readily be observed between different categories. In this analysis, genes that have multiple copies in the genome were ignored. Table S2 was generated by listing all gene pairs that have > 0.5 absolute scRNA correlation and have > 1 normalized TCC reads between the two 1Mb locus.
DATA AND CODE AVAILABILITY
The accession numbers for the data reported in this paper are GSE113014 and GSE139565. All software used for data analysis and visualization in this study is publicly available, usages are detailed in the STAR Methods: Quantification and Statistical Analysis section, and sources are defined in the References and Key Resources Table.
Supplementary Material
Highlights.
Plasma cell fate is orchestrated by elaborate changes in nuclear architecture
The Ebf1 locus relocates to the peri-centromeric heterochromatin in plasma cells
Plasma cell fate is associated with de novo inter-chromosomal hubs
Inter-chromosomal hubs are enriched for H3K27Ac or H3K27me3
ACKNOWLEDGMENTS
We thank Maho Niwa for critical reading of the manuscript. Sequencing was performed at the Institute for Genomic Medicine Center, University of California, San Diego. Imaging was performed at the University of California, San Diego School of Medicine Microscopy Core (P30 NS047101). We thank S. Nutt (Walter and Eliza Hall Institute of Medical Research) for Blimp1-GFP mice, Anjana Rao for the LMP vector, and current and past members of the Murre lab for their advice and assistance throughout the project. We thank Claudia Bossen for her technical assistance with TCC and Sven Heinz for suggested modifications to the TCC protocol. A.B. was supported by a Ruth L. Kirschstein National Research Service Award (1F32GM106631-01A1). M.D. was supported by the Frontiers in Innovation Scholars Program. This study was supported by the Center for Computational Biology and Bioinformatics (CCBB) (UL1TRR001442) and the NIH to C.M. (AI102853 and AI100880).
Footnotes
DECLARATION OF INTERESTS
The authors declare no competing interests.
SUPPLEMENTAL INFORMATION
Supplemental Information can be found online at https://doi.org/10.1016/j.celrep.2020.03.034.
REFERENCES
- Bettigole SE, and Glimcher LH (2015). Endoplasmic reticulum stress in immunity. Annu. Rev. Immunol 33, 107–138. [DOI] [PubMed] [Google Scholar]
- Brangwynne CP, Eckmann CR, Courson DS, Rybarska A, Hoege C, Gharakhani J, Jülicher F, and Hyman AA (2009). Germline P granules are liquid droplets that localize by controlled dissolution/condensation. Science 324, 1729–1732. [DOI] [PubMed] [Google Scholar]
- Brangwynne CP, Mitchison TJ, and Hyman AA (2011). Active liquid-like behavior of nucleoli determines their size and shape in Xenopus laevis oocytes. Proc. Natl. Acad. Sci. USA 108, 4334–4339. [DOI] [PMC free article] [PubMed] [Google Scholar]
- Buenrostro JD, Giresi PG, Zaba LC, Chang HY, and Greenleaf WJ (2013). Transposition of native chromatin for fast and sensitive epigenomic profiling of open chromatin, DNA-binding proteins and nucleosome position. Nat Methods. 10, 1213–1218. [DOI] [PMC free article] [PubMed] [Google Scholar]
- Bunting KL, Soong TD, Singh R, Jiang Y, Béguelin W, Poloway DW, Swed BL, Hatzi K, Reisacher W, Teater M, et al. (2016). Multi-tiered reorganization of the genome during B cell affinity maturation anchored by a germinal center-specific locus control region. Immunity 45, 497–512. [DOI] [PMC free article] [PubMed] [Google Scholar]
- Butler A, Hoffman P, Smibert P, Papalexi E, and Satija R. (2018). Integrating single-cell transcriptomic data across different conditions, technologies, and species. Nat Biotechnol. 36, 411–420. [DOI] [PMC free article] [PubMed] [Google Scholar]
- Chan EA, Teng G, Corbett E, Choudhury KR, Bassing CH, Schatz DG, and Krangel MS (2013). Peripheral subnuclear positioning suppressed Tcrb recombination and segregates Tcrb alleles from RAG2. Proc. Natl. Acad. Sci. USA 110, E4628–E4637. [DOI] [PMC free article] [PubMed] [Google Scholar]
- Chen S, Miyazaki M, Chandra V, Fisch KM, Chang AN, and Murre C. (2016). Id3 orchestrates germinal center B cell development. Mol. Cell. Biol 36, 2543–2552. [DOI] [PMC free article] [PubMed] [Google Scholar]
- Chernova I, Jones DD, Wilmore JR, Bortnick A, Yucel M, Hershberg U, and Allman D. (2014). Lasting antibody responses are mediated by a combination of newly formed and established bone marrow plasma cells drawn from clonally distinct precursors. J. Immunol 193, 4971–4979. [DOI] [PMC free article] [PubMed] [Google Scholar]
- Chesi M, and Bergsagel PL (2013). Molecular pathogenesis of multiple myeloma: basic and clinical updates. Int. J. Hematol 97, 313–323. [DOI] [PMC free article] [PubMed] [Google Scholar]
- Cuartero S, Weiss FD, Dharmalingam G, Guo Y, Ing-Simmons E, Masella S, Robles-Rebollo I, Xiao X, Wang YF, Barozzi I, et al. (2018). Control of inducible gene expression links cohesin to hematopoietic progenitor self-renewal and differentiation. Nat. Immunol 19, 932–941. [DOI] [PMC free article] [PubMed] [Google Scholar]
- Denholtz M, Zhu Y, He Z, Lu H, Isoda T, Döhrmann S, Nizet V, and Murre C. (2020). Upon microbial challenge, human neutrophils undergo rapid changes in nuclear architecture and chromatin folding to orchestrate an immediate inflammatory gene program. Genes Dev. 34, 149–165. [DOI] [PMC free article] [PubMed] [Google Scholar]
- Ebert A, McManus S, Tagoh H, Medvedovic J, Salvagiotto G, Novatchkova M, Tamir I, Sommer A, Jaritz M, and Busslinger M. (2011). The distal V(H) gene cluster of the Igh locus contains distinct regulatory elements with Pax5 transcription factor-dependent activity in pro-B cells. Immunity 34, 175–187. [DOI] [PubMed] [Google Scholar]
- Gloury R, Zotos D, Zuidscherwoude M, Masson F, Liao Y, Hasbold J, Corcoran LM, Hodgkin PD, Belz GT, Shi W, et al. (2016). Dynamic changes in Id3 and E-protein activity orchestrate germinal center and plasma cell development. J. Exp. Med 213, 1095–1111. [DOI] [PMC free article] [PubMed] [Google Scholar]
- Goldmit M, Ji Y, Skok J, Roldan E, Jung S, Cedar H, and Bergman Y. (2005). Epigenetic ontogeny of the Igk locus during B cell development. Nat. Immunol 6, 198–203. [DOI] [PubMed] [Google Scholar]
- Hammarlund E, Thomas A, Amanna IJ, Holden LA, Slayden OD, Park B, Gao L, and Slifka MK (2017). Plasma cell survival in the absence of B cell memory. Nat. Commun 8, 1781. [DOI] [PMC free article] [PubMed] [Google Scholar]
- Hiepe F, Dörner T, Hauser AE, Hoyer BF, Mei H, and Radbruch A. (2011). Long-lived autoreactive plasma cells drive persistent autoimmune inflammation. Nat. Rev. Rheumatol 7, 170–178. [DOI] [PubMed] [Google Scholar]
- Hu G, Cui K, Fang D, Hirose S, Wang X, Wangsa D, Jin W, Ried T, Liu P, Zhu J, et al. (2018). Transformation of accessible chromatin and 3D nucleome underlies lineage commitment of early T cells. Immunity 48, 227–242.e8. [DOI] [PMC free article] [PubMed] [Google Scholar]
- Huang S, Deerinck TJ, Ellisman MH, and Spector DL (1997). The dynamic organization of the perinucleolar compartment in the cell nucleus. J. Cell Biol. 137, 965–974. [DOI] [PMC free article] [PubMed] [Google Scholar]
- Isoda T, Moore AJ, He Z, Chandra V, Aida M, Denholtz M, Piet van Hamburg J, Fisch KM, Chang AN, Fahl SP, et al. (2017). Non-coding transcription instructs chromatin folding and compartmentalization to dictate enhancer-promoter communication and T cell fate. Cell 171, 103–119.e18. [DOI] [PMC free article] [PubMed] [Google Scholar]
- Jhunjhunwala S, van Zelm MC, Peak MM, and Murre C. (2009). Chromatin architecture and the generation of antigen receptor diversity. Cell 138, 435–448. [DOI] [PMC free article] [PubMed] [Google Scholar]
- Johanson TM, Lun ATL, Coughlan HD, Tan T, Smyth GK, Nutt SL, and Allan RS (2018). Transcription-factor-mediated supervision of global genome architecture maintains B cell identity. Nat. Immunol 19, 1257–1264. [DOI] [PubMed] [Google Scholar]
- Kalhor R, Tjong H, Jayathilaka N, Alber F, and Chen L. (2011). Genome architectures revealed by tethered chromosome conformation capture and population-based modeling. Nat. Biotechnol 30, 90–98. [DOI] [PMC free article] [PubMed] [Google Scholar]
- Kallies A, Hasbold J, Tarlinton DM, Dietrich W, Corcoran LM, Hodgkin PD, and Nutt SL (2004). Plasma cell ontogeny defined by quantitative changes in blimp-1 expression. J. Exp. Med 200, 967–977. [DOI] [PMC free article] [PubMed] [Google Scholar]
- Khanna N, Zhang Y, Lucas JS, Dudko OK, and Murre C. (2019). Chromosome dynamics near the sol-gel phase transition dictate the timing of remote genomic interactions. Nat. Commun 10, 2771. [DOI] [PMC free article] [PubMed] [Google Scholar]
- Kieffer-Kwon KR, Tang Z, Mathe E, Qian J, Sung MH, Li G, Resch W, Baek S, Pruett N, Grøntved L, et al. (2013). Interactome maps of mouse gene regulatory domains reveal basic principles of transcriptional regulation. Cell 155, 1507–1520. [DOI] [PMC free article] [PubMed] [Google Scholar]
- Kieffer-Kwon KR, Nimura K, Rao SSP, Xu J, Jung S, Pekowska A, Dose M, Stevens E, Mathe E, Dong P, et al. (2017). Myc regulates chromatin decompaction and nuclear architecture during B cell activation. Mol. Cell 67, 566–578.e10. [DOI] [PMC free article] [PubMed] [Google Scholar]
- Kind J, Pagie L, de Vries SS, Nahidiazar L, Dey SS, Bienko M, Zhan Y, Lajoie B, de Graaf CA, and Amendola M. (2015). Genome-wide maps of nuclear lamina interactions in single human cells. Cell 163, 134–147. [DOI] [PMC free article] [PubMed] [Google Scholar]
- Kind J, Pagie L, Ortabozkoyun H, Boyle S, de Vries SS, Janssen H, Amendola M, Nolen LD, Bickmore WA, and van Steensel B. (2013). Single-cell dynamics of genome-nuclear lamina interactions. Cell 153, 178–192. [DOI] [PubMed] [Google Scholar]
- Li B, Kremling KAG, Wu P, Bukowski R, Romay MC, Xie E, Buckler ES, and Chen M. (2018). Coregulation of ribosomal RNA with hundreds of genes contributes to phenotypic variation. Genome Res. 28, 1555–1565. [DOI] [PMC free article] [PubMed] [Google Scholar]
- Lieberman-Aiden E, van Berkum NL, Williams L, Imakaev M, Ragoczy T, Telling A, Amit I, Lajoie BR, Sabo PJ, Dorschner MO, et al. (2009). Comprehensive mapping of long-range interactions reveals folding principles of the human genome. Science 326, 289–293. [DOI] [PMC free article] [PubMed] [Google Scholar]
- Lin KI, Angelin-Duclos C, Kuo TC, and Calame K. (2002). Blimp-1-dependent repression of Pax-5 is required for differentiation of B cells to immunoglobulin M-secreting plasma cells. Mol. Cell. Biol 22, 4771–4780. [DOI] [PMC free article] [PubMed] [Google Scholar]
- Lin YC, Benner C, Mansson R, Heinz S, Miyazaki K, Miyazaki M, Chandra V, Bossen C, Glass CK, and Murre C. (2012). Global changes in the nuclear positioning of genes and intra- and interdomain genomic interactions that orchestrate B cell fate. Nat. Immunol 13, 1196–1204. [DOI] [PMC free article] [PubMed] [Google Scholar]
- Lomvardas S, Barnea G, Pisapia DJ, Mendelsohn M, Kirkland J, and Axel R. (2006). Interchromosomal interactions and olfactory receptor choice. Cell 126, 403–413. [DOI] [PubMed] [Google Scholar]
- Maharana S, Iyer KV, Jain N, Nagarajan M, Wang Y, and Shivashankar GV (2016). Chromosome intermingling-the physical basis of chromosome organization in differentiated cells. Nucleic Acids Res. 44, 5148–5160. [DOI] [PMC free article] [PubMed] [Google Scholar]
- Mansson R, Welinder E, Åhsberg J, Lin YC, Benner C, Glass CK, Lucas JS, Sigvardsson M, and Murre C. (2012). Positive intergenic feedback circuitry, involving EBF1 and FOXO1, orchestrates B-cell fate. Proc Natl Acad Sci U S A 109, 21028–21033. [DOI] [PMC free article] [PubMed] [Google Scholar]
- McStay B. (2016). Nucleolar organizer regions: genomic ‘dark matter’ requiring illumination. Genes Dev. 30, 1598–1610. [DOI] [PMC free article] [PubMed] [Google Scholar]
- Monahan K, Schieren I, Cheung J, Mumbey-Wafula A, Monuki ES, and Lomvardas S. (2017). Cooperative interactions enable singular olfactory receptor expression in mouse olfactory neurons. eLife 6, e28620. [DOI] [PMC free article] [PubMed] [Google Scholar]
- Murre C. (2019). Helix-loop-helix proteins and the advent of cellular diversity: 30 years of discovery. Genes Dev. 33, 6–25. [DOI] [PMC free article] [PubMed] [Google Scholar]
- Nagano T, Lubling Y, Várnai C, Dudley C, Leung W, Baran Y, Mendelson Cohen N, Wingett S, Fraser P, and Tanay A. (2017). Cell-cycle dynamics of chromosomal organization at single-cell resolution. Nature 547, 61–67. [DOI] [PMC free article] [PubMed] [Google Scholar]
- Park SK, Xiang Y, Feng X, and Garrard WT (2014). Pronounced cohabitation of active immunoglobulin genes from three different chromosomes in transcription factories during maximal antibody synthesis. Genes Dev. 28, 1159–1164. [DOI] [PMC free article] [PubMed] [Google Scholar]
- Peric-Hupkes D, Meuleman W, Pagie L, Bruggeman SW, Solovei I, Brugman W, Grä f S, Flicek P, Kerkhoven RM, van Lohuizen M, et al. (2010). Molecular maps of the reorganization of genome-nuclear lamina interactions during differentiation. Mol. Cell 38, 603–613. [DOI] [PMC free article] [PubMed] [Google Scholar]
- Quong MW, Harris DP, Swain SL, and Murre C. (1999). E2A activity is induced during B-cell activation to promote immunoglobulin class switch recombination. EMBO J. 18, 6307–6318. [DOI] [PMC free article] [PubMed] [Google Scholar]
- Rao SS, Huntley MH, Durand NC, Stamenova EK, Bochkov ID, Robinson JT, Sanborn AL, Machol I, Omer AD, Lander ES, et al. (2014). A 3D map of the human genome at kilobase resolution reveals principles of chromatin looping. Cell 159, 1665–1680. [DOI] [PMC free article] [PubMed] [Google Scholar]
- Sexton T, and Cavalli G. (2015). The role of chromosome domains in shaping the functional genome. Cell 160, 1049–1059. [DOI] [PubMed] [Google Scholar]
- Shaffer AL, Lin KI, Kuo TC, Yu X, Hurt EM, Rosenwald A, Giltnane JM, Yang L, Zhao H, Calame K, and Staudt LM (2002). Blimp-1 orchestrates plasma cell differentiation by extinguishing the mature B cell gene expression program. Immunity 17, 51–62. [DOI] [PubMed] [Google Scholar]
- Slifka MK, Antia R, Whitmire JK, and Ahmed R. (1998). Humoral immunity due to long-lived plasma cells. Immunity 8, 363–372. [DOI] [PubMed] [Google Scholar]
- Tourigny MR, Ursini-Siegel J, Lee H, Toellner KM, Cunningham AF, Franklin DS, Ely S, Chen M, Qin XF, Xiong Y, et al. (2002). CDK inhibitor p18(INK4c) is required for the generation of functional plasma cells. Immunity 17, 179–189. [DOI] [PubMed] [Google Scholar]
- van der Maaten L, and Hinton G. (2008). Visualizing Data using t-SNE. Journal of Machine Learning Research 9, 2579–2605. [Google Scholar]
- Wöhner M, Tagoh H, Bilic I, Jaritz M, Poliakova DK, Fischer M, and Busslinger M. (2016). Molecular functions of the transcription factors E2A and E2–2 in controlling germinal center B cell and plasma cell development. J. Exp. Med 213, 1201–1221. [DOI] [PMC free article] [PubMed] [Google Scholar]
Associated Data
This section collects any data citations, data availability statements, or supplementary materials included in this article.
Supplementary Materials
Data Availability Statement
The accession numbers for the data reported in this paper are GSE113014 and GSE139565. All software used for data analysis and visualization in this study is publicly available, usages are detailed in the STAR Methods: Quantification and Statistical Analysis section, and sources are defined in the References and Key Resources Table.