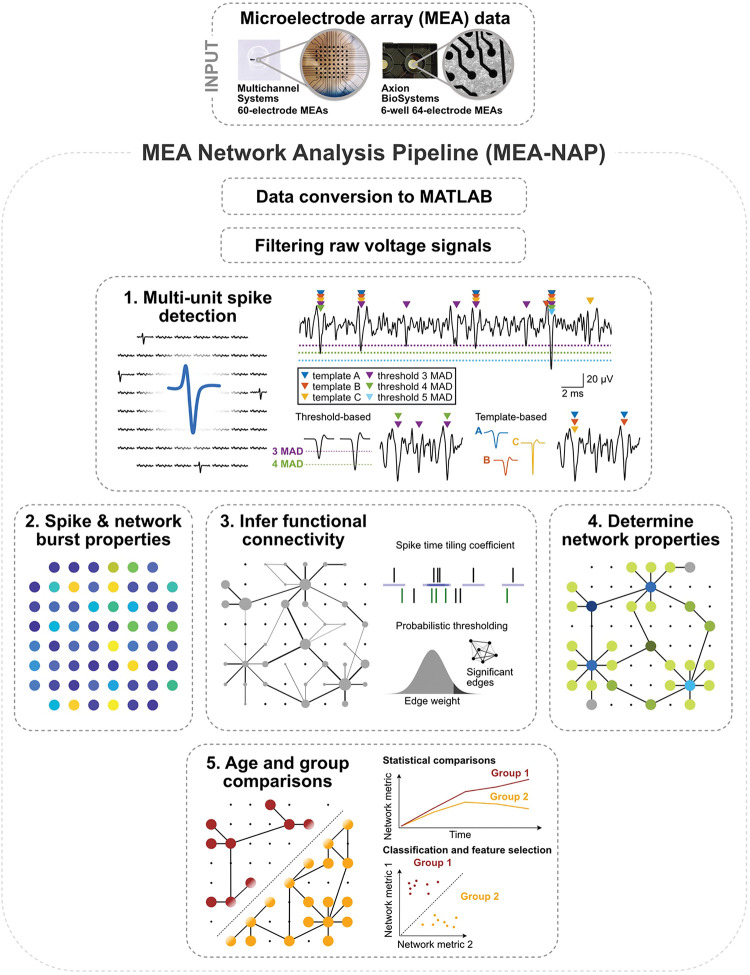
Figure 1. Overview of the MEA-NAP.
Illustration of microelectrode array (MEA) network analysis pipeline (MEA-NAP) steps 1–5. MEA data from 60- (Multichannel systems single-well) or 64-electrode (Axion Biosystems, 6-well plates) MEA systems serves as input to the pipeline. The data is converted to MATLAB format, and the raw voltage signal is filtered. 1. Multi-unit spike detection is performed to extract the action potential time series from each electrode. Left, action potentials detected from multiple electrodes in the MEA. Right top, sample voltage trace from a single electrode showing spikes detected (colored arrows) by different template-based and threshold-based methods. Right bottom, example action potentials detected by median absolute deviation (MAD) 3 or 4 thresholds. Example wavelets (A-C) serve as templates for detecting spikes. 2. Neuronal activity compares the spike and network burst properties within and between MEA recordings. 3. Functional connectivity is determined from significant pairwise correlation of the neuronal activity (left) by combining the spike time tiling coefficient with probabilistic thresholding (right). 4. Network activity compares multiple network topological and dynamic features. Illustration highlights node cartography for identify hub and non-hub nodal roles. 5. Statistical analysis illustrates age and group comparisons and feature selection.

