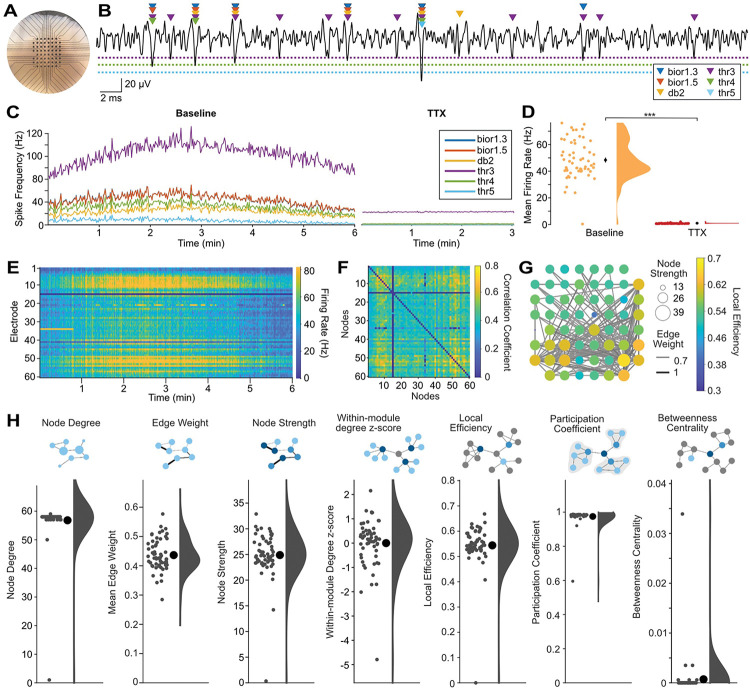
Figure 2. MEA-NAP offers template-based multi-unit spike detection and automated analysis of functional connectivity and network topology in 3D human cerebral organoids.
A. Representative photo of an air-liquid interface cortical organoid (ALI-CO) on the microelectrode array (MEA). Scale: electrodes (black circles) are 200 μm apart. B. Sample 60-ms-long voltage trace (black line) from a single electrode showing comparison of spikes detected by the continuous wavelet transform with templates bior1.3, bior1.5, and db2 and by a median absolute deviation threshold of 3, 4 and 5 (colored triangles) in a days-in-vitro (DIV) 154 ALI-CO. Dashed lines show thresholds (3, 4, 5 in the same colors as triangles). Scale bars: vertical 20 uV, horizontal, 2 ms. C. Comparison of spike detection methods with running averages of spikes per second for all electrodes in the MEA for each method (colored lines, see legend) over a 6-minute baseline recording (left) and after application of 1 μM tetrodotoxin (TTX) to block action potentials (right). D. Scatter with half-violin plot of density curve for mean firing rate by electrode during baseline recording and after TTX using the multi-unit template-based spike detection. Mean (black circles) ± SEM (error bars). *** p<0.00001 (paired two-tailed t-test). Where error bars are not visible indicates the SEM was smaller than the size of the circle. E. Raster plot shows firing rate (spikes per second, color bar on right) for each electrode (row) over the 6-minute recording using the multi-unit template-based spike detection. F. Adjacency matrix shows correlation coefficient (spike time tiling coefficient, color bar) for significant functional connections (edges) between pairs of electrodes (nodes). Significant edges determined using probabilistic thresholding. G. Graph of network illustrating functional connectivity in the ALI-CO. Nodes show node strength (circle size) and edge weight (line thickness) strength of connectivity. Only edges with edge weight greater than 0.55 are plotted to show the strongest functional connections. Node color (scale bar) represents local efficiency. H. Summary of nodal-level graph metrics for the DIV154 ALI-CO. Diagrams depict nodal-level graph metrics. Scatter plots show values for individual nodes (small gray circles), mean ± SEM (large black circle with error bars), and density curves.

