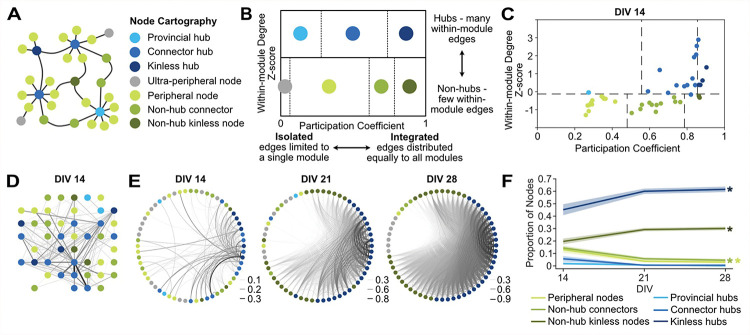
Figure 4. Node cartography reveals the roles of individual nodes in network activity.
A. Schema of a network shows 7 different node cartography roles including hub (blue) and non-hub (green and gray) designations. B. Diagram shows how node cartography roles (colors) are determined based on the within-in module degree z-score and participation coefficient. C. Scatter plot of node cartography (color) for a representative 2D mouse cortical culture at days-in-vitro (DIV) 14. Boundaries (dashed lines) for determining hub versus non-hub and subtypes were automatically set for the experimental dataset in MEA-NAP using the density landscape (not pictured). D. Network plot with node cartography (color) in the spatial arrangement of the MEA. Nodes (circles) and edges (lines) show functional connectivity for the representative culture in C. E. Circular network plots show development of node cartography (colors) and functional connectivity (lines show edges) for representative 2D mouse cortical culture from DIV 14–28. Line thickness represents edge weights (scaled for each DIV) to show modularity. F. Comparison of the proportion of node cartography roles (colors) for the entire dataset of 2D mouse cortical cultures (n=19) from DIV 14–28. Mean (solid lines) ± SEM (shading). There were significant effects of age (* p<0.001, one-way ANOVA).

