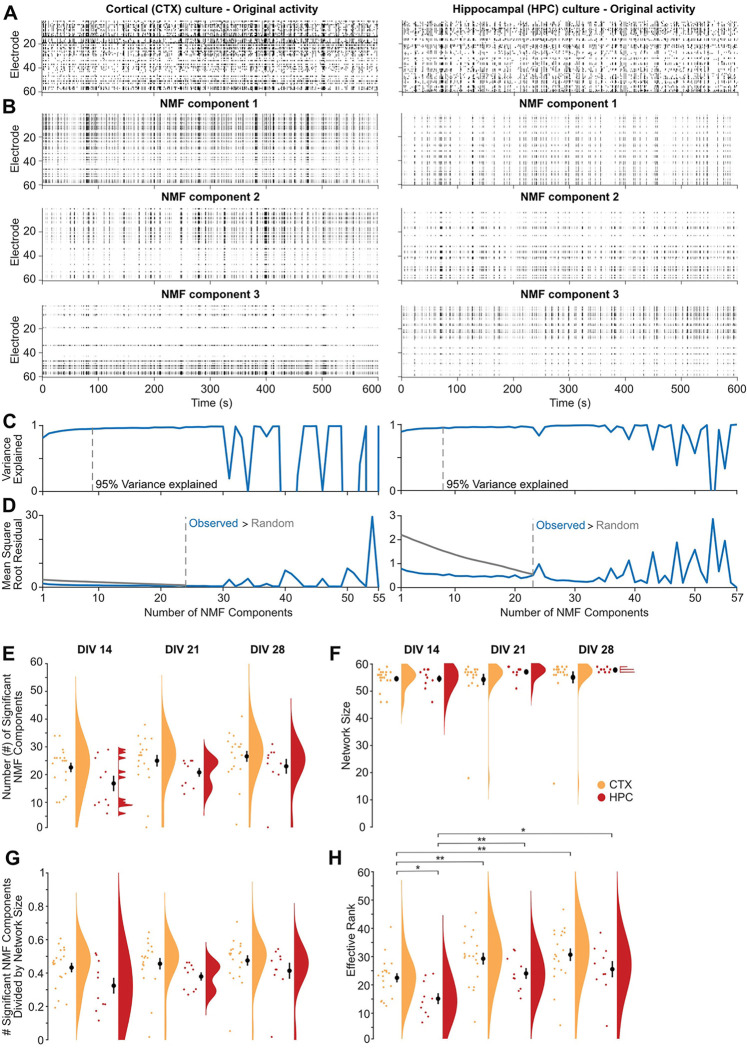
Figure 5. Dimensionality reduction approaches reveal fewer subcommunities in 2D mouse hippocampal than cortical cultures.
A. Raster plots of representative MEA recordings from 2D primary cortical (left) and hippocampal (right) murine cultures at DIV 21 show action potential firing rate (binned by 100 ms) by electrode (rows) for 10 minutes of spontaneous activity. B. Raster plots of the top three non-negative matrix factorization (NMF) components for the MEA recordings in A. C. Number of NMF components that explained 95% of variance (dashed gray line) in the MEA recordings in A. D. Comparison of the mean square root residual by the number of NMF components for the MEA recordings in A (blue line) and the MEA recordings shuffled. The number of significant components (dashed line) was determined where the mean square root residual from the observed recordings was greater than that from the shuffled recordings (random). E-H. Scatterplot, mean ± SEM, and density curves for number of NMF components (E), network size (F), number of NMF components normalized by network size (G), and effective rank (H) comparisons by age and cortical (CTX, orange, n=19) versus hippocampal (HPC, red, n=10) cultures.

