Table 1.
Functional connectivity, network topology, and network dynamic metrics in MEA-NAP
| Nodal-level Feature | Description | Recording-level Feature | Description |
|---|---|---|---|
| Basic features of the network | |||
Node degree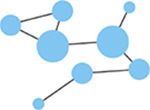
|
Number of connections (edges) with other nodes in the network. Highly connected nodes may have more influence on network activity. | Network size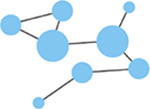
|
Number of active electrodes (defined by a minimum number or frequency of spikes detected). |
Edge weight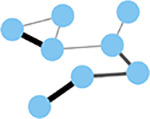
|
Strength of connectivity between two nodes. Calculated using the spike-time tiling coefficient (Cutts & Eglen, 2014) | Network density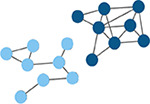
|
Number of edges as a proportion (%) of the total possible edges that can be formed in the network. |
Node strength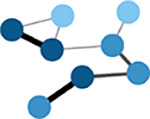
|
Sum of the edge weights for each node. | ||
| Local processing in the network | |||
Local efficiency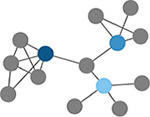
|
Efficiency defined at the level of individual nodes. The inverse of path length of the subgraph generated by removing the index node and its edges. (Latora & Marchiori, 2001) | Clustering coefficient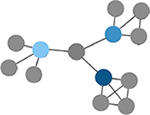
|
Probability that two nodes each directly connected to a third node will also be directly linked to each other. |
Within-module degree z-score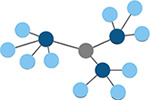
|
Measure of how well-connected a node is to other nodes in the same module. Higher values indicate higher intramodular node degree. (Guimerà & Nunes Amaral, 2005) | Number of modules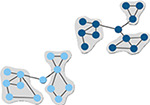
|
Number of subsets of nodes into which the network can be decomposed, where nodes in each subset are more densely connected to each other than to nodes in other subsets. (Brandes et al., 2008) |
| Affiliation vector | Vector containing the number of the module to which each node belongs. | Modularity score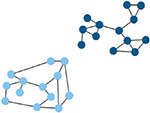
|
A value between −0.5 and 1 that describes how well a network has been partitioned. (Lancichinetti & Fortunato, 2012) |
| Global processing and nodal roles in the network | |||
Betweenness centrality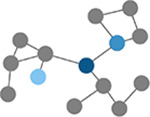
|
Number of times a node lies on the shortest path between any two nodes in a network. (Brandes, 2001) | Path length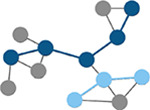
|
Characteristic path length is the minimum number of edges required to link any two nodes in the network averaged across nodes. |
Participation coefficient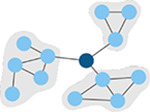
|
Measure of how well-distributed a node’s edges are among different modules. (Guimerà & Nunes Amaral, 2005) | Global efficiency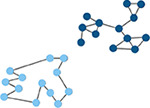
|
Efficiency of parallel information transfer between nodes in the network. Inverse of characteristic path length. (Latora & Marchiori, 2001) |
Node cartography group proportions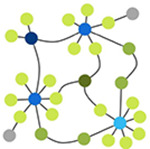
|
Each node is assigned a role by node cartography group. (Guimerà & Nunes Amaral, 2005) 1. Peripheral nodes 2. Non-hub connectors 3. Non-hub kinless nodes 4. Provincial hubs 5. Connector hubs 6. Kinless hubs |
Small-world coefficient, Method 1 (σ)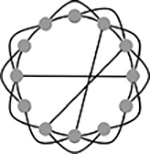
|
Network topology with clusters of nodes connected to other clusters via hub nodes. This reduces path length and facilitates both local and global information processing. Calculated as clustering coefficient divided by characteristic path length. (Humphries et al, 2006) |
| Hub score | Hubs are nodes with high centrality in the network. Nodes are ranked based on node strength, betweenness centrality, local efficiency, and participation coefficient. Hubs rank in the top 10% of nodes in 3 or 4 of these features. (Schroeter et al., 2015) | Small-world coefficient, Method 2 (ω) | Calculated using the normalized clustering coefficient and path length. Small-world network structure is at the midpoint (0) between a lattice (−1) and random (1) network structure. (Telesford et al., 2011) |
|
| |||
| Network dynamics | |||
| Non-negative matrix factorization (NMF) | Dimensionality reduction approach identifies patterns of activity in the network and the number of electrodes participating in each pattern. | Effective Rank | Dimensionality reduction approach calculates the number of sub-communities within the network. (Roy & Vetterli, 2007) |
