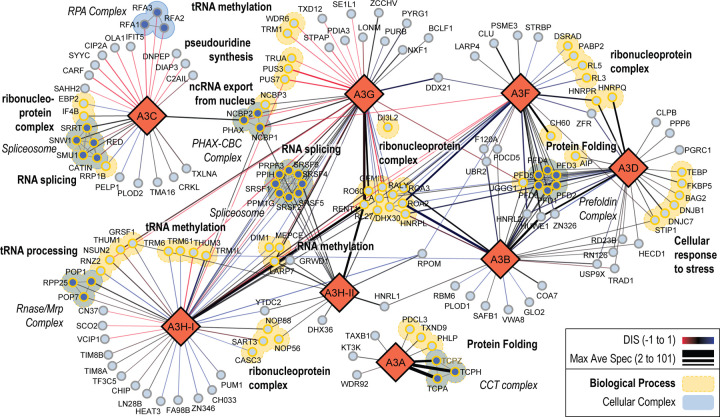
Figure 2. The A3 family RNA-dependent and RNA-independent PPI network.
Protein interactions are depicted as edges drawn between two protein nodes with the edge thickness representing the maximum of the average spectral count (Max Ave Spec from 2 to 101) for a particular bait-prey pair. Edge color represents the DIS of the pairwise interaction from −1 to 1, with −1 being confidently identified only in NT (red), 1 being confidently identified only in RNAse+ conditions (blue), and 0 indicating similar interaction in both conditions (black). Gray edges are prey-prey interactions from known protein complexes. The A3 proteins are represented as large diamond nodes, and the identified prey proteins are represented as circular light blue nodes. Prey proteins involved in select enriched cellular complexes, are depicted as filled in blue nodes. Prey proteins involved in select biological processes are depicted with yellow colored borders.

