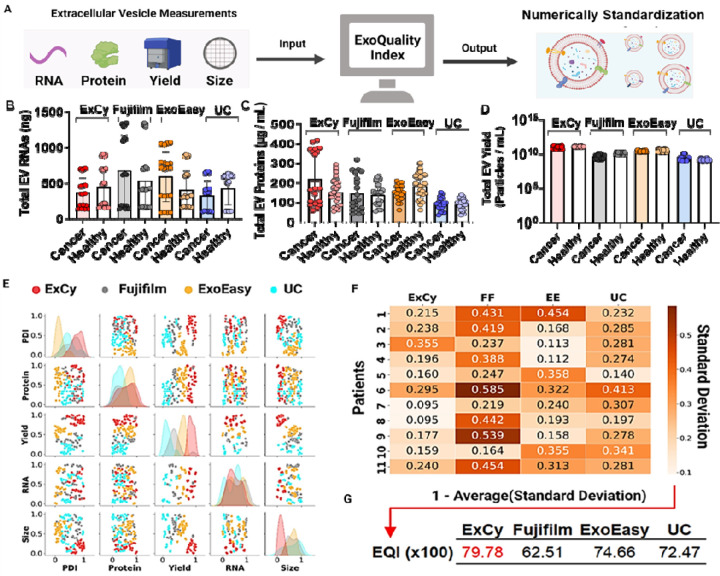
Figure 3. Statistical analysis using ExoQuality algorithm (EQI) to standardize EV isolation method for comparison.
A. Schematic illustration on how ExoQuality to evaluate quality of EV isolates based on EV characterizations. B. Stratification of patients to further investigate method-dependent observed total EV RNAs, C) EV proteins, and D) EV particle yield. E. Scatter plot matrix comparing the association of each EV measurement across the isolation methods. The particle dispersity index (PDI)86 is a representation of the EV size distribution within a sample population, detailing observed heterogeneity. PDI was calculated as where NTA is the size profile and σ is the standard deviation. All isolations were done at the same date and location. The data was then transformed to a uniform distribution to adjust for each method’s bias contribution, applying a probabilistic rescaling within each EV measurement. F. A sample-by-method standard deviation matrix was calculated from each method’s covariation matrix per sample. Within the probalistic rescaling, a standard deviation value of 0.5 represents a likelihood to observe 50% deviation after resampling. G. The ExoQuality index metric used for direct comparison between EV isolation methods, intepreted as the expected likelihood of EV homogeneity, after resampling to observe similar measurements.

