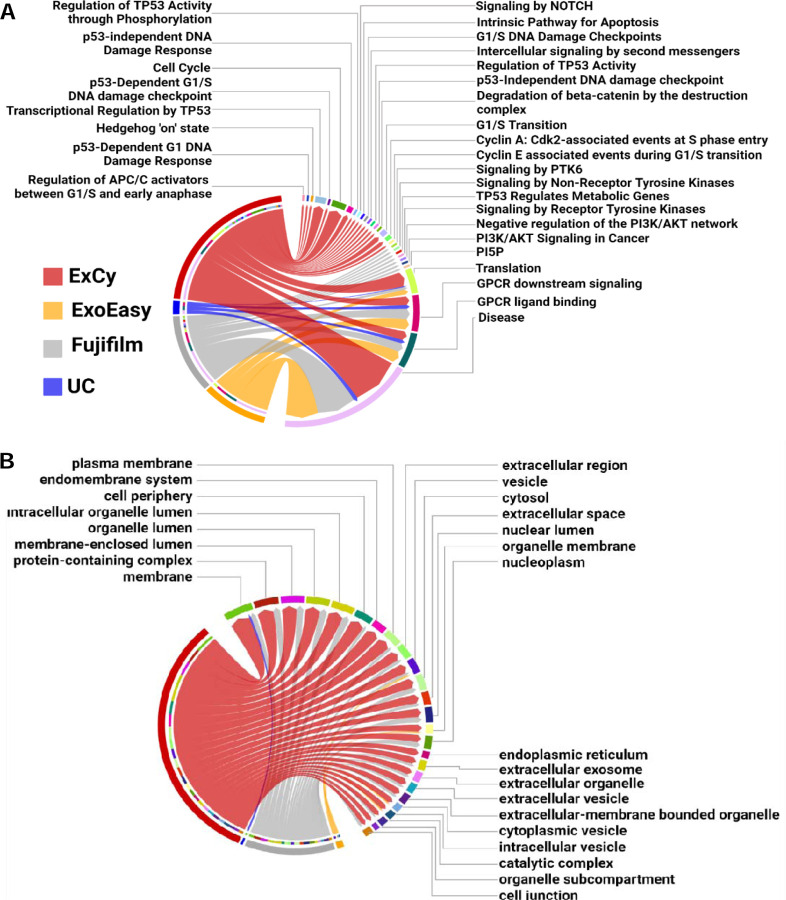
Figure 5. ExCy obtains statistically more EV-related and specific pathways that indicate the cancer and pancreatic cancer pathways from exploratory analysis.
(A) Chord plot illustrating, at an exploratory level, pancreatic cancer related pathways associated to method dependent isolated EVs. The edges in the chord plot represent the number of annotated mRNAs found in each pathway. (B) An additional chord plot illustrating the top 25 statistically significant cellular component pathways found by gProfiler after separate differential analysis between EV isolation methods by edgeR on pancreatic cancer patients (N=4) and healthy control (N=3), then ranking differential transcripts to each isolation method across all patient samples (N=7).

