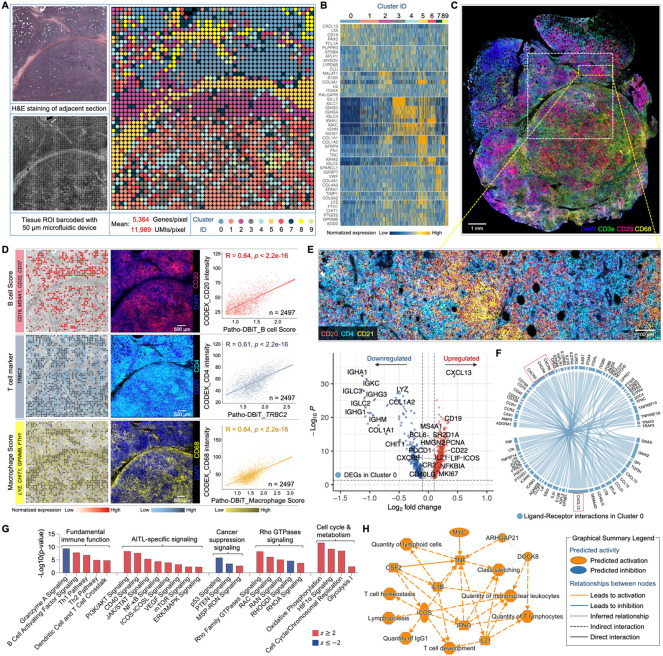
Figure 3. High-sensitivity spatial transcriptomics of a AITL sample stored for five years.
(A) Spatial transcriptome mapping of a subcutaneous nodule section from a patient diagnosed with AITL. The FFPE block has been stored at room temperature for five years before the Patho-DBiT assay. Left top: H&E staining of an adjacent section. Left bottom: tissue scanning post 50μm-microfluidic device barcoding. Right: unsupervised clustering revealed 10 distinct clusters, aligning closely with the H&E tissue histology.
(B) Heatmap showing top ranked DEGs defining each cluster.
(C) Spatial phenotyping of an adjacent section using the CODEX technology (Co-Detection by Indexing). White square indicates the region of interest (ROI) in (A).
(D) Spatial distributions of B cells, T cells, and macrophages revealed by Patho-DBiT, exhibiting a strong Pearson correlation with the proteomic data generated from CODEX. Genes defining each module score are listed.
(E) Top: CODEX data from the yellow square indicated area in (C) showing active expression of B cell marker (CD20), T follicular helper cell (Tfh) marker (CD4), and follicular dendritic cell marker (CD21). Bottom: Volcano plot of DEGs in Cluster 0 corresponding to the indicated region.
(F) Ligand-receptor interactions within Cluster 0. The distinctive communication pattern between CXCL13 and its receptor genes (CXCR3, CXCR4, and CXCR5) is indicated. Edge thickness is proportional to correlation weights.
(G) Corresponding canonical signaling pathways regulated by the DEGs in Cluster 0. z score is computed and used to reflect the predicted activation level (z>0, activated; z<0, inhibited; z≥2 or z≤−2 can be considered significant).
(H) Graphical network of canonical pathways, upstream regulators, and biological functions regulated by DEGs identified in Cluster 0.

