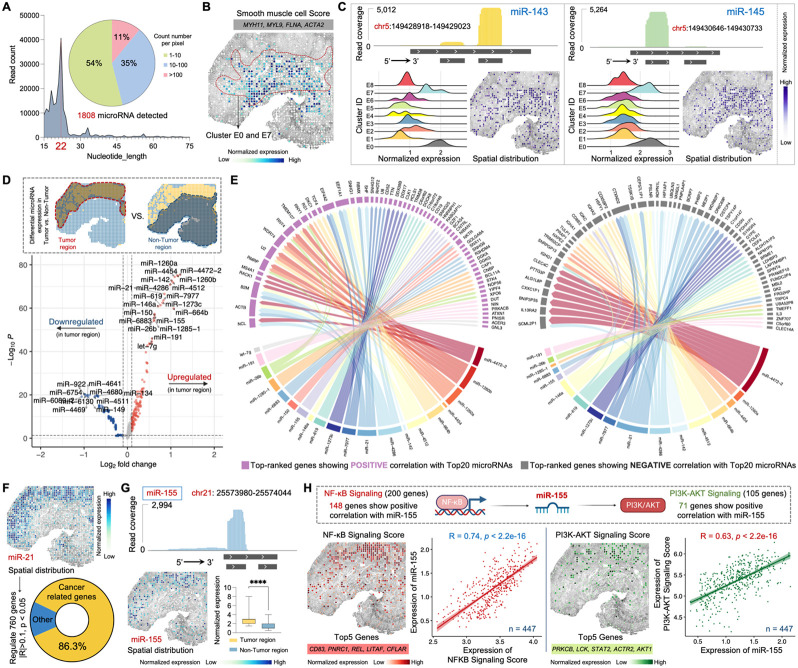
Figure 5. Spatial microRNA-mRNA regulatory network in the MALT section.
(A) MicroRNAs detected by Patho-DBiT in the MALT section, with the count of mapped reads peaking at 22 nucleotides. The pie chart illustrates the percentage distribution of the detected count number per spatial pixel.
(B) Spatial distribution of the Smooth muscle cell Score. Genes defining this module score are listed.
(C) Spatial mapping of smooth muscle cell specific miR-143 and miR-145. The read coverage mapped to the reference genome location, expression proportion in each identified cluster, and spatial distribution are shown.
(D) Volcano plot showing differentially expressed microRNAs between the tumor and non-tumor regions.
(E) Regulatory network between the top 20 upregulated microRNAs and the gene expression in the tumor region. Genes with the highest rankings, demonstrating positive or negative correlations with the microRNAs, were separately illustrated. Edge thickness is proportional to correlation weights.
(F) Spatial expression map of the oncomiR miR-21. This microRNA significantly regulates 760 genes (Pearson R > 0.1 or < −0.1, p-value < 0.05). Cancer-related genes are defined based on the IPA data base.
(G) Spatial expression map of the B-cell lymphoma enriched miR-155. Top: read coverage mapped to the reference genome location. Bottom left: spatial distribution. Bottom right: expression comparison between tumor and non-tumor regions. Box whiskers show the minimum and maximum values. Significance level was calculated with two-tailed Mann-Whitney test, **** P < 0.0001.
(H) Spatial interactions involving mir-155 and its upstream and downstream signaling pathways. Top 5 genes defining each module score are listed. The Pearson correlation between mir-155 expression and both signaling pathways was calculated across 447 spatial pixels within the tumor region.

