

Abstract
The expression of antibiotic-inactivating enzymes, such as Pseudomonas-derived cephalosporinase-3 (PDC-3), is a major mechanism of intrinsic resistance in bacteria. To explore the relationships between structural dynamics and altered substrate specificity as a result of amino acid substitutions in PDC-3, innovative computational methods like machine learning driven adaptive bandit molecular dynamics simulations and markov state modeling of the wild-type PDC-3 and nine clinically identified variants were conducted. Our analysis reveals that structural changes in the Ω-loop controls the dynamics of the active site. The E219K and Y221A substitutions have the most pronounced effects. The modulation of three key hydrogen bonds K67(sc)-G220(bb), Y150(bb)-A292(bb) and N287(sc)-N314(sc) were found to result in an expansion of the active site, which could have implications for the binding and inactivation of cephalosporins. Overall, the findings highlight the importance of understanding the structural dynamics of PDC-3 in the development of new treatments for antibiotic-resistant infections.
Keywords: PDC-3, Pseudomonas aeruginosa, E219K, ceftolozane resistance, molecular dynamics, Markov state model
Introduction
Pseudomonas aeruginosa is a ubiquitous Gram-negative bacterium from the family Pseudomonadaceae (Pang et al., 2019). This pathogen is commonly found in hospitals and other healthcare settings, where it can cause infections in people who are immunocompromised or have chronic conditions (Kerr and Snelling, 2009). Pseudomonal infections are associated with high morbidity and mortality in many groups, including patients with cystic fibrosis, pneumonia, and chronic obstructive pulmonary disease (COPD) (Malhotra et al., 2019, Jurado-Martin et al., 2021, Reynolds and Kollef, 2021, Curran et al., 2018). β-lactam antibiotics, characterized by the presence of a β-lactam ring in their chemical structure, are often the first-line of treatment for bacterial infections as they tend to have fewer side effects and are less toxic than other antibiotics (Mora-Ochomogo and Lohans, 2021). Mechanistically, β-lactams work by inhibiting the synthesis of the bacterial cell wall, which is necessary for the survival and growth of bacteria (Lima et al., 2020). β-lactam antibiotics are usually effective against a wide range of bacteria, but they can lose their effectiveness if the bacteria develop resistance to them.
P. aeruginosa is known for its ability to develop resistance to multiple classes of antimicrobial drugs (Pang et al., 2019, Horcajada et al., 2019, Spagnolo et al., 2021). Therefore, the greatest challenge to eradicating P. aeruginosa infections are multidrug-resistant (MDR) and extensively drug-resistant (XDR) isolates. The World Health Organization has identified P. aeruginosa as a top-priority pathogen for research and development of new antibiotics due to its ability to cause serious infections and its increasing resistance to currently available treatment options (Tacconelli et al., 2018).
The production of antibiotic-inactivating enzymes is one of the major mechanisms of intrinsic resistance in bacteria (Munita and Arias, 2016). P. aeruginosa can possess a class C β-lactamase, named Pseudomonas-derived cephalosporinase (PDC), which is an antibiotic-inactivating enzyme (Colque et al., 2022). PDC-3 is a serine β-lactamase that can inactivate a broad range of β-lactam antibiotics, including penicillins, cephalosporins, monobactams, and carbapenems, by breaking the amide bond of the β-lactam ring through an active site serine (Fig.1 A and B) (Tripathi and Nair, 2013, Tripathi and Nair, 2016, Pang et al., 2019). Cephalosporins are known to be highly susceptible to PDC-3 inactivation (Barnes et al., 2018). The active site of PDC-3 is located at the intersection of the enzyme’s α-helical and α/β domains (Fig.1 D). The active site can be further divided into two distinct regions: the R1 site and the R2 site. These regions are defined by the specific binding interactions they facilitate with the R1 and R2 side chains of the cephalosporins, respectively (Fig1. A). The R1 site is surrounded by the Ω-loop, while the R2 site is encased by the R2-loop, which comprises the a helix H-10. The Ω-loop and the R2-loop are located at opposite ends of the active site, with the catalytic serine residue situated in the middle (Jacoby, 2009). However, the Ω-loop and R2-loop, are particularly prone to amino acid substitutions, insertions, and deletions that expand the active site and accommodate larger R1 and R2 groups of the cephalosporins (Nordmann and Mammeri, 2007). These modifications have been observed to enhance the capacity of the enzyme to hydrolyze a wider range of β-lactam antibiotics (Barnes et al., 2018). The evolution of PDC-3 lactamase and its amino acid variants, which often result in enhanced catalytic activity and expanded-spectrum of cephalosporin hydrolysis, has garnered considerable interest in scientific research (Ruedas-Lopez et al., 2022). As previously reported, several PDC-3 Ω-loop variants, including V211A, V211G, G214A, G214R, E219A, E219G, E219K, Y221A and Y221H were found in highly drug-resistant P. aeruginosa clinical isolates (Barnes et al., 2018).
Figure 1.

(A) Structures of representative β-lactam antibiotics. The notation R (R1/R2) represents the point of addition of functional groups. (B) Structures of commonly used cephalosporins. (C) General mechanism of PDC-3 β-lactamase hydrolysis of cephalosporins. (D) The structure of PDC-3. The overall structure of the protein is shown in the cartoon representation (PDB ID: 4HEF). The Ω-loop and R2-loop are colored orange and red, respectively. The conserved residues in the active sites are colored green and highlighted in sticks.
In this study, machine learning driven adaptive bandit molecular dynamics (MD) simulations and markov state modeling were employed as a powerful computational tool to gain a detailed understanding of the structural and dynamic behavior of PDC-3 and its variants at the atomistic level. MD simulations enable researchers to investigate the motion and interactions of atoms and molecules over time, providing valuable insights into the behavior of biomolecules such as proteins (Hollingsworth and Dror, 2018). By analyzing the conformational ensembles and kinetics of PDC-3 through markov state models, this study aimed to uncover the underlying structural mechanisms governing the function of PDC-3 and its variants. Understanding the molecular mechanisms of PDC-3 function and the development of resistance is of paramount importance in treating P. aeruginosa infections. This knowledge can aid in the development of more effective treatments to combat these bacteria.
Methodology
Initial model preparation
Ten independent all-atom MD simulations of wild-type PDC-3 and its variants were performed. The X-ray crystallographic structure of the PDC-1 at 1.86 Å (PDB ID: 4HEF) obtained from the Protein Data Bank (Lahiri et al., 2013). The PDC-1 structure was converted to PDC-3 by introducing the T105A substitution. PDC-3 wild-type and nine variants (V211A, V211G, G214A, G214R, E219A, E219G, E219K, Y221A, and Y221H) were constructed in silico using the ICM mutagenesis program (Abagyan et al., 1994). To ensure the accurate protonation states of the protein, PROPKA 3.0 was employed to assign the protonation states of N-terminus, C-terminus, cationic residues, and anionic residues based on a neutral pH local environment and the protonation states and side chain orientations were also checked by visual inspection (Olsson et al., 2011). In addition, all acidic residues were negatively charged, while alkaline Lys and Arg residues remained positively charged. His was protonated based upon the suggestion by PROPKA 3.0 analysis.
Adaptive Bandit simulations
The processed structures served as the starting point for the following molecular dynamics (MD) simulations. Multi-microsecond MD simulations of wild-type PDC-3 and its variants were conducted using the Amberff14SB force-field for protein (Maier et al., 2015). All simulations were run using the ACEMD engine (Harvey et al., 2009, Doerr et al., 2016). Each structure was solvated in a pre-equilibrated periodic cubic box of water molecules represented by the three-point charge TIP3P model, whose boundary is at least 10 Å from any atoms so that the protein does not interact with its periodic images. Periodic boundary conditions in all directions were utilized to reduce finite system size effects. The potassium ions were added to make each system electrically neutral. Long-range electrostatic interactions were computed using the particle mesh Ewald summation method (Cerutti et al., 2009). Subsequently, each system was energy minimized for 5000 steps by conjugate gradient to remove any local atomic clashes and then equilibrated for 5 ns in the NPT ensemble at 1 atmospheric pressure using Berendsen barostat (Feenstra et al., 1999).
Initial velocities within each simulation were sampled from Boltzmann distribution at temperature of 300 K. Isothermic-isobaric NVT ensemble using a Langevin thermostat with a damping of 0.1 ps−1 and hydrogen mass repartitioning scheme to achieve time steps of 4 fs. Multiple short MSM-based adaptively sampled simulations were run using the ACEMD molecular dynamics engine (Doerr et al., 2016, Harvey et al., 2009). The standard adaptive sampling algorithm performs several rounds of short parallel simulations. To avoid any redundant sampling, the algorithm generates an MSM discretized conformational space and uses the stationary distribution of each state to obtain an estimate of their free energy. It then selects any sampled conformation from a low free energy stable state and respawns a new round of simulations. In this context, the MetricSelfDistance function was set to consider the number of native Cα contacts formed for all residues, which were then used to build the MSMs. The exploration value was 0.01 and goal-scoring function was set to 0.3. For each round, 4 simulations of 300 ns were run in parallel until the cumulative time exceeded 30 μs. The trajectory frames were saved every 0.1 ns. 100 trajectories were collected with each trajectory counting 3000 frames.
Markov state models
The PyEMMA software (version 2.5.9) was employed to construct the Markov state models (Scherer et al., 2015, Husic and Pande, 2018). The software determines the kinetically relevant metastable states and their inter-conversion rate from all trajectories of the all-atom molecular dynamics of the wild-type PDC-3 and its variants. Firstly, to evaluate the MSM construction, the conformations defining each frame of the MD trajectories were converted into an intuitive basis. In this step, the features which can represent the slow dynamical modes of these systems were selected. Then, the conformational space was projected to a two-dimensional space using time-lagged independent component analysis (TICA) (Perez-Hernandez and Noe, 2016). Using the k-means clustering technique, all conformations from MD simulations were grouped into microstates based on the TICA embedding (Peng et al., 2018). The conformations in the same cluster are geometrically similar and interconvert quickly. After that, the transition matrix between the microstates was built using Bayesian estimation at the appropriate lag time (Trendelkamp-Schroer and Noe, 2013). The lag time was selected where the implied time scales converged, and the transitions between the microstates became the Markovian process. Each indicated time scale represents the average transition time between two groups of states. The microstates were then clustered into a few metastable states using Perron cluster cluster analysis++ (PCCA++) based on their kinetic similarities (Bowman et al., 2009). Additionally, the implied time scale (ITS) plots and the Chapman−Kolmogorov (CK) test was performed to validate the constructed model further (Barendregt et al., 2019). The CK test measures the reliability of the Markov state models by comparing the predicted residence probability of each microstate obtained from MSMs with those directly computed from MD simulations at longer timescales. Furthermore, the free energies for each metastable state (Si) were computed from its stationary MSM probability π using the relation:
where πi denotes the MSM stationary weight of the jth macrostate, kB is the Boltzmann constant, and T is the temperature. Subsequently, the mean first passage times (MFPT) out of and into the macrostate Si were computed using the Bayesian MSM (Polizzi et al., 2016).
Structural analysis
MDTraj is a robust software package that facilitates the analysis of molecular dynamics (MD) simulations by enabling the manipulation of MD trajectory data from a variety of files (McGibbon et al., 2015). The package provides Python-based tools that allow for the efficient computation of structural and dynamic properties of biomolecules. In this study, MDTraj was utilized to compute several important metrics that are critical in the analysis of MD simulations. Specifically, we used MDTraj to calculate the root-mean-square-fluctuations (RMSF) and root-mean-square-deviation (RMSD) of the protein structure, as well as the χ1 torsion angle, hydrogen bonds, salt bridges and the solvent-accessible surface area (SASA). RMSF measures the fluctuations of atoms during MD simulations with respect to an averaged structure, while RMSD indicates the protein’s conformational changes during MD simulations, used to evaluate simulation stability. The χ1 torsion angles were calculated for each residue except for alanine and glycine. Hydrogen bonds were defined as a distance of less than 3.5 Å between a hydrogen bond donor and acceptor, with a donor-hydrogen-acceptor angle greater than 30°. Salt bridges were defined as a distance of less than 4.0 Å between a positively charged amino acid side chain (lysine or arginine) and a negatively charged side chain (aspartate or glutamate). The volume of the active site pocket was calculated using ParkVFinder (Guerra et al., 2020). Visualization of the structures of protein was performed using PyMOL (Schrödinger, LLC).
Results and Discussion
Amino acid substitutions change the flexibility of Ω-loops and R2-loops
Both root-mean-square deviation (RMSD) analysis and root-mean-square fluctuations (RMSF) analysis provide insights into the dynamic behavior and structural differences of biomolecules (Martinez, 2015, Prabantu et al., 2022). Firstly, the structural stability of the overall conformation of the wild-type PDC-3 and its variants was investigated using pairwise RMSD analysis. The values are visually represented through a color gradient, with blue indicating a low deviation, red indicating a high deviation, and yellow indicating a moderate deviation (Fig.2 A). The results of the RMSD analysis reveal that the wild-type PDC-3 displays a relatively low degree of structural variability, indicating that the protein maintains a relatively consistent overall conformation over time. Similarly, the V211G, G214A, and Y221H variants also exhibit low RMSD values, which suggests that these structures are less flexible. In contrast, the V211A and E219G variants exhibit the highest RMSD values among the set of structures, indicating a high level of structural variability. This implies that these substitutions lead to increased conformational fluctuations in the protein over time. The Y221A, E219K, G214R and G214A variants exhibit RMSD values that are intermediate between the wild-type and the most flexible variants, indicating that these amino acid substitutions have a moderate effect on the structural stability of the protein’s conformation, i.e., not as significant as the V211A and E219G substitutions.
Figure 2:

A. Pairwise Root Mean Square Deviation (RMSD) comparison of wild-type PDC-3 and its variants. The matrix shows the RMSD values between each pair of structures, with the rows and columns representing the structures. The color intensity represents the RMSD value, with lower values indicating a higher degree of structural similarity between the structures. This visualization can be used to identify patterns and trends in the structural stability of the set of structures and demonstrate the impact of substitutions on the overall conformational stability of the protein. B. The root-mean-square fluctuation (RMSF) of wild-type PDC-3 and its variants. The Ω-loop (residues G183 to S226) is highlighted in yellow, and the R2-loop (residues L280 to Q310) is highlighted in blue. (C) Core Ca root-mean-square deviation (RMSD) superimposition from PDC-3 and its mutants. The blue parts represent the least mobile Ca atoms (80%) while the red parts highlight the most mobile atoms (20\%).
To identify regions that contribute the most to the conformational changes in the wild-type PDC-3 and its variants, the RMSF values of Cα atoms were calculated. High RMSF values indicate a high degree of flexibility or mobility for the corresponding atoms, while low RMSF values indicate a significant degree of rigidity or immobility (Bornot et al., 2011). The wild-type PDC-3 and G214A, G214R, E214G and Y221A variants exhibit high flexibility in the Ω-loops, as evidenced by the relatively large RMSF values observed. Conversely, the V211A, V211G, E219K and Y221H variants are characterized by more constrained conformations in the Ω-loops. The V211A and V211G variants show the highest stability in the Ω-loop, as inferred by their relatively lower RMSF values, followed by E219K and Y221H variants. In terms of the R2-loop, wild-type PDC-3 displays a relatively low degree of flexibility while all variants exhibit an increase in structural flexibility. This suggests that these substitutions have a significant impact on the stability of the R2-loops, potentially affecting enzyme function. A detailed observation of the individual variants reveals that the V211A variant exhibits a particularly high degree of flexibility, as evidenced by the comparatively higher RMSF values, followed by the E219G variant. On the other hand, the Y221A and Y221H variants exhibit a relatively lower degree of flexibility, as inferred by the lower RMSF values observed (Fig.2 B). Therefore, the flexibility of these proteins is mainly caused by the fluctuations in the Ω-loops and R2-loop.
The importance of Ω-loops and R2-loops in class C β-lactamases has been previously confirmed. These loops play a crucial role in the binding and activity of the class C β-lactamases (Philippon et al., 2022). Specifically, residues V211 and Y221 within the Ω-loops have been identified to engage in hydrophobic interactions with the R1 side chains of cephalosporins. The substitution of V211A has been reported to be associated with acquired resistance to cefepime or cefpirome (Rodriguez-Martinez et al., 2010). Additionally, the characteristic aminothiazole ring found in most third-generation cephalosporins interacts with Y221 in an edge-to-face manner, which represents typical quadrupole−quadrupole interactions. However, Y221 can sometimes create steric clashes that prevent ligands from entering the binding sites (Powers and Shoichet, 2002, Barnes et al., 2018). Deletion of Y221 has been observed to broaden substrate specificity and confer resistance to ceftazidime-avibactam (Lahiri et al., 2015). Moreover, the expanded Ω-loop of P99, another member of class C β-lactamases, exhibits conformational flexibility that may facilitate the hydrolysis of oxyimino β-lactams by making the acyl intermediate more accessible to attack by water (Crichlow et al., 1999). In terms of the R2-loops, it has been observed that the N289 (N287 in PDC-3) forms hydrogen-bonding interactions with the C4 carboxylate hydrogen bonds directly in the AmpC/13 (moxalactam) complex (Crichlow et al., 2001). Furthermore, the T289, A292, and L293 residues within the R2-loops of class C β-lactamases have been found to exhibit hydrophobic contacts with the dimethyl group in the R2 chains of cephalosporins (Powers and Shoichet, 2002). Additional research suggests that the removal of the R2 group in cephalosporins frequently involves the breaking of the dihydrothiazine ring, while the R1 group remains intact (Perez-Inestrosa et al., 2005, Chaudhry et al., 2019). This observation indicates that the high flexibility of the R2-loops could be a crucial factor in stabilizing substrates during both the acylation and deacylation steps simultaneously. Overall, the flexibility or mobility of the Ω-loops and R2-loops allows the PDC-3 active site cavity to adopt different size and shapes, thus affecting the binding of different β-lactams and allowing for extended-spectrum activity of some class C β lactamases against oxyimino-cephalosporins and oxacephems.
E219K and Y221A may facilitate the proton transfer of catalytic residues.
The substitution of E219 to K219 or Y221 to A221 leads to conformational changes in the active site. Notably, crucial residues S64 and K67 undergo clear conformational alterations. In the E219K substitution, nearly half of the structures display gauche(−) (60°) conformations for S64, which is uncommon in the wild-type and other variants. The Y221A substitution also shows limited gauche(−) (60°) conformations for S64. Regarding K67, gauche(+) (−60°) conformations dominate in the wild-type PDC-3 and other variants, but almost 50% of the structures exhibit trans (180°) conformations with the E219K substitution (Fig. 3 A, B and C). This could potentially have implications for the catalytic activity of the enzyme, as S64 is a catalytic residue involved in the acylation step of the β-lactamase. K67 is believed to act as a general base in the acylation step of the β-lactamase catalytic mechanism, abstracting a proton from the hydroxyl group of S64, which in turn facilitates the nucleophilic attack of the β-lactam ring (Tripathi and Nair, 2016, Tripathi and Nair, 2013).
Figure 3.

Density distribution of the chi1 torsion angles of (A) S64 and (B) K67 in wild-type PDC-3 and its variants. (C) Hydrogen bond interactions in structures shown K67(NZ)-S64(OG), K67(NZ)-N152(OD1), and K67(NZ)-G220(O) are formed from wild-type PDC-3 (orange) but broken in the E219K (pink) and Y221A (blue) variants. (D) The K67(NZ)-G220(O), Y150(N)-A292(O), and N287(ND2)-N314(OD1) interactions in structures from wild-type PDC-3 (orange), V211A (green), and Y221A (blue) variants. The yellow dashed lines represent the interactions. (E) The active site pockets of wild-type PDC-3 (orange), V211A (green), and Y221A (blue) variants are shown as surface representation.
In addition, the conformational changes of S64 and K67 can impact the formation of hydrogen bonds (Table 1). Specifically, the hydrogen bond formation between K67(NZ) and S64(OG) is observed in most wild-type PDC-3 and variant structures, but it is broken in most structures observed in the E219K and Y221A variants. The fractions of formation for this hydrogen bond in E219K and Y221A are only 30.36% and 40.05%, respectively. The mechanism of proton transfer in class A β-lactamases was reported to be from S70 (which corresponds to S64 in PDC-3) to the catalytic water molecule, and subsequently from the water molecule to E166 (Pemberton et al., 2020). While not explicitly observed in class C β-lactamases yet, it is also possible that a similar proton transfer during substrate binding and catalysis is involved here, similar to that seen in class A β-lactamases, as both are serine β-lactamases. However, if S64 consistently forms stable hydrogen-bond interactions with K67, it would be challenging to transfer the proton from S64 to the positively charged amino acid. Therefore, the loss of the hydrogen bond between K67(NZ) and S64(OG) in E219K and Y221A variants might help the proton transfer to occur efficiently to facilitate the hydrolysis of β-lactams. It is worth noting that the formation of K67(NZ)-N152(OD1) and K67(NZ)-G220(O) interactions are also greatly decreased in the E219K and Y221A variants. Both experimental and computational data suggest that the K67 plays a central role in the proton transfer process (Meroueh et al., 2005). The proton shuttling process occurs between the positively charged K73 (corresponding to K67 in PDC-3) and the negatively charged S70 (S64 in PDC-3) before the formation of the transition state (TS). Therefore, the loss of the K67(NZ)-N152(OD1) and K67(NZ)-G220(O) interaction might allow K67 to adopt additional conformations to facilitate the proton transfer. This is also consistent with the experimental results that the E219K and Y221A variants demonstrate a large increase in susceptibility to cephalosporins (Barnes et al., 2018).
Table 1.
The Frac)on (%) of the Forma)on of Cri)cal Hydrogen Bonds in the Ac)ve Sites.
| WT | V211A | V211G | G214A | G214R | E219A | E219G | E219K | Y221A | Y221H | |
|---|---|---|---|---|---|---|---|---|---|---|
| K67(NZ)-S64(OG) | 69.59 | 64.75 | 69.54 | 57.25 | 40.32 | 61.49 | 53.72 | 30.36 | 40.05 | 69.58 |
| K67(NZ)-N152(OD1) | 26.77 | 16.76 | 19.73 | 36.57 | 40.74 | 22.59 | 30.95 | 13.04 | 22.77 | 22.67 |
| K67(NZ)-G220(O) | 63.2 | 64.52 | 65.09 | 49 | 24.11 | 47.97 | 31.7 | 27.67 | 28.58 | 63.54 |
| Y150(N)-A292(O) | 72.94 | 21.9 | 29.36 | 43.77 | 40.92 | 24.25 | 15.67 | 27.42 | 20.53 | 20.39 |
| N287(ND2)-N314(OD1) | 55.09 | 25.49 | 36.42 | 37.07 | 21.15 | 18.72 | 20.41 | 29.77 | 22.51 | 27.04 |
Substitutions enlarge the active-site pocket to accommodate bulkier R1 and R2 groups of β-lactams.
In wild-type PDC-3, the K67(NZ)-G220(O) hydrogen bond is formed in 63.20% of simulations (Table 1). However, in the variants G214R, E219G, E219K, and Y221A, the percentages of forming this hydrogen bond are decreased, with fractions of formation ranging from 24.11% in G214R to 31.70% in E219G. In the Y150(N)-A292(O) interaction, the wild-type PDC-3 forms this hydrogen bond in 72.94% of simulations. The V211A, V211G, E219A, E219G, E219K, Y221A, and Y221H variants have significantly lower percentages of formation, ranging from 15.67% to 29.3%. Therefore, substitution of the V211, E219, and Y221 residues will affect this hydrogen bond considerably. In addition, one observes that in PDC-3, approximately 55.09% of the structures form the hydrogen bond (N287(ND2)-N314(OD1)). However, in the variant structures, most do not form this hydrogen bond, only a few do with a range of 18.72% to 36.42%. Residues G220 is positioned in the Ω-loop, while A292, N287, and N314 are located in the R2-loop. Therefore, the disruption of the K67(NZ)-G220(O) interaction in PDC-3 leads to the expansion of the R1 site, allowing for substrates with larger R1 side chains such as ceftolozane and ceftazidime to be accommodated. Similarly, the loss of the Y150(N)-A292(O) and N287(ND2)-N314(OD1) interactions could potentially enlarge the R2 site of PDC-3, providing additional space for R2 side chains of cephalosporins. The confirmation of these observations can be supported by analyzing the pocket volumes and solvent accessible surface areas (Table 2). In the simulations with the Y221A, E219K, and E219G variants, it was observed that all three interactions were disrupted in the majority of structures. On the other hand, the G214A variant displayed relatively lower fractions of all three interactions compared to other variants. Consequently, it exhibited the smallest active-site pocket among all variants, even resembling the wild-type PDC-3. Based on these findings, we infer that the R1 site of the G214R, E219G, E219K, and Y221A variants should undergo a noticeable increase in size. Additionally, the R2 site is expected to experience an increase volume in all variants except G214A and G214R.
Table 2.
The pocket volume (Å3) and solvent accessible surface area (SASA) (Å2) of the active site pocket.
| System | WT | V211A | V211G | G214A | G214R | E219A | E219G | E219K | Y221A | Y221H |
|---|---|---|---|---|---|---|---|---|---|---|
| Volume (Å3) | 1071.81±157.54 | 1182.23±200.19 | 1181.68±187.35 | 1075.46±259.79 | 1115.24±241.80 | 1206.33±221.87 | 1211.74±250.02 | 1278.62±293.00 | 1381.32±302.32 | 1210.70±182.42 |
| SASA (Å2) | 391.07±11.59 | 391.73±10.13 | 391.54±10.75 | 394.02±13.32 | 398.51±17.83 | 396.92±12.13 | 400.31±14.64 | 40.67±1.71 | 406.73±17.07 | 399.28±10.32 |
A previous study by Barnes et al., has shown that G214R, E219G, E219K, and Y221A variants exhibit greater susceptibility to ceftolozane and ceftazidime (Barnes et al., 2018). However, their susceptibility to cefotaxime and cefepime, which have smaller R1 side chains, was not significantly affected (Barnes et al., 2018). Moreover, metadynamics studies have also indicated that there will be a lower free energy barrier for the acylation reaction when this interaction between A220 (the equivalent position of G220 in PDC-3) and K67 is broken in the complex of CBL and aztreonam (Tripathi and Nair, 2013). However, only E219G, E219K, and Y221A demonstrate an obvious increase in susceptibility to ceftolozane while other variants only show minor changes. This difference in susceptibility might be attributed to the relatively smaller R1 site. The other variants had more structures capable of forming interactions between K67(NZ) and G220(O), which could potentially reduce the impact on their susceptibility to ceftolozane.
Kinetic models and their validation
The utilization of Markov state models (MSMs) enabled the analysis of long-term conformational alterations of wild-type PDC-3 and its variants by filtering out local fluctuations related to thermal motion and focusing on underlying conformational transformations. All distances of the salt bridges and hydrogen bonds related to conserved active motifs (S64XXK67, Y150SN152, K315TG317), Ω-loop (residues G183 to S226), and the R2-loop (residues L280 to Q310) were calculated. To establish the correlation between structural dynamics and active site pockets, correlation coefficients were computed between the distances of these interactions and the volume of the active site pocket. A correlation coefficient exceeding 0.3 or falling below −0.3 indicates a positive or negative relationship, respectively. Only the distances of salt bridges and hydrogen bonds that exhibited a positive or negative relationship with the volume of the active site pockets were selected as features to construct the MSMs. This resulted in the selection of 9 salt bridges and 24 hydrogen bonds (Table 3).
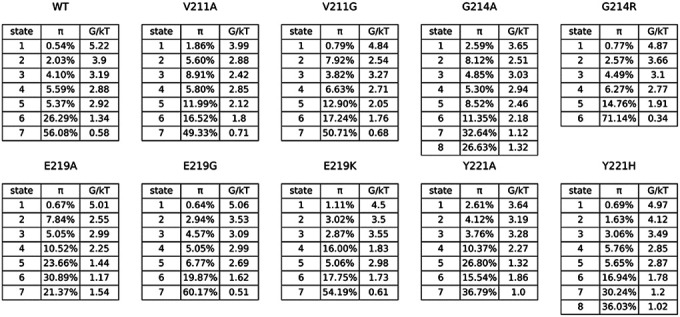
Table 3.
Stationary Probability and the Free Energy of Metastable States of PDC-3 and its mutants.
|
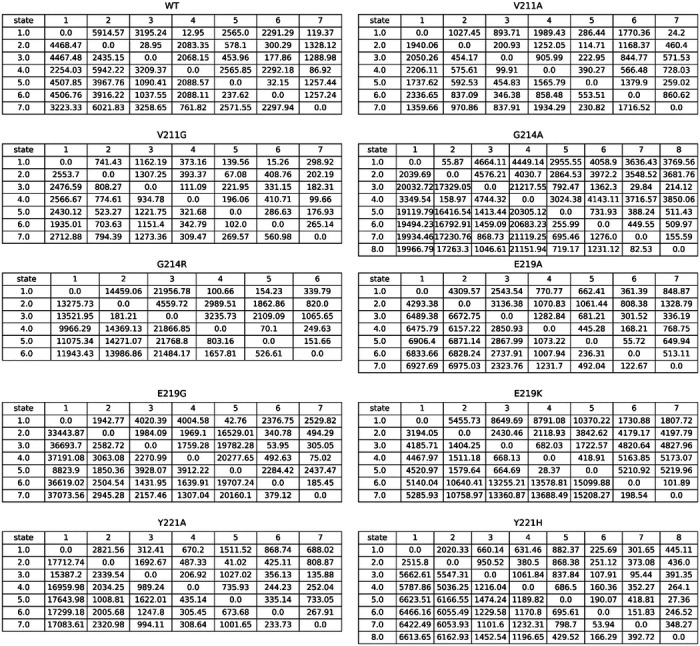
From the metastable state results, we noticed that the most stable state of E219K demonstrated that all the hydrogen bonds mentioned above are broken (Fig. 4). In addition, the metastable states with the obvious loss of the K67(NZ)-S64(OG), K67(NZ)-N152(OD1), and K67(NZ)-G220(O) can only be observed in the E219K and Y221A variants, which are observable in state 1, state 6, and state 7 states of E219K, and state 3 of Y221A. However, according to the mean first passage time (MFPT) results, the conformations from state 1, state 6, and state 7 states of the E219K variant take a long time to transition to state 3 where all three hydrogen bonds were formed ranging from 8262.0 ± 2573.0 ns to 12769.0 ± 3327.0 ns. Conversely, in the Y221A variant, state 3, where all three hydrogen bonds were broken, could easily transition to other metastable states, including the most stable state 7, where all three hydrogen bonds were formed. This was reflected in a very short MFPT of 780.2 ± 46.8 ns. Although the MFPT from state 7 to state 3 was longer, showing 1737.6 ± 139.7 ns, it was still much shorter than that of the E219K variant.
Figure 4.

(A) The free energy landscape for the microstates of the wild-type PDC-3 and its mutants. (B) The metastable states grouped from microstates of PDC-3 and its variants systems. The microstates were grouped by the PCCA method into metastable states in all systems.
The hydrogen bond between Y150(N)-A292(O) is commonly broken in variants, but metastable states can still form these bonds in certain instances, such as in state 7 of the V211A variant, state 5, state 7, state 8 of the G214A variant, state 7 of the G214R variant, and state 6 of the E219K variant. This hydrogen bond is likely to play a crucial role in maintaining the R2-loop’s proximity to the active site and stabilizing other hydrogen bonds. Although the fraction of time these bonds are formed in the V211A variant is similar to other variants, the R2-loop in V211A is more flexible due to the ease of formation and loss of the hydrogen bonds. In certain structures, such as state 6 of V211A, state 3 of G214A, state 4 of G214R, and state 1 and state 5 of E219K, the hydrogen bonds are observed to be lost. The transition of conformations between different states varies in time, with V211A taking 876.8 ± 78.0 ns to transfer from state 6 to state 7, and 1874.8 ± 177.6 ns to transfer from state 7 to state 6. In contrast, the MFPT of G214A transition from state 3 to state 5, state 7, state 8 are 2089.0 ± 389.3, 1608.2 ± 368.0, 1685.1 ± 373.3 ns, and transition from state 5, state 7 and state 8 to state 3 are 13175.0 ± 3162.7, 13648.1 ± 3172.1, 13657.1 ± 3171.0 ns. The G214R variant takes 1701.6 ± 551.9 ns to transfer from state 4 to state 7, while it takes 24040.6 ± 7186.8 ns to transfer from state 7 to state 4, indicating that breaking the hydrogen bond is much harder than forming it. Similarly, formation and loss of the hydrogen bond in the E219K variant both characterized by high energy barriers, inferred from the long MFPT (Table 4).
Table 4.
Mean first passage )me (MFPT) values for the transfer between metastable states.
|
According to the Perron Cluster-Cluster Analysis (PCCA) results, we observe that V211A, V211G, G214R, E219G, and E219K variants show metastable states with N287(ND2)-N314(OD1) completely broken. In the case of V211A, state 7 is dominated by conformations that have formed these hydrogen bonds. However, state 3 and state 4 show that the hydrogen bonds are lost. The transition from state 2 to state 3 is facile and takes only 133.3 ± 12.8 ns, while the transition from state 3 to state 5 takes 238.4 ± 27.2 ns. In V211G, state 3 and state 4 states exhibit the loss of these hydrogen bonds. Their formation takes only 48.3 ± 4.1 ns, whereas the loss takes 613.7 ± 56.6 ns. Despite the W-loop being highly stable in V211A and V211G, these states can easily adopt different conformations for the R2-loop, thereby accommodating b-lactams with larger R2 sites. In E219G, state 6 and state 7 show these hydrogen bonds formed and broken, respectively. The MFPT from state 6 to state 7 is 220.9 ± 23.5 ns, while the MFPT from state 7 to state 6 is 333.1 ± 19.7 ns. Therefore, high flexibility also can be observed in the R2-loop of the E219G variant. In the case of G214R, the transformation from state 3 and 4 to state 6, which corresponds to the formation of the hydrogen bond, takes 411.3 ± 21.5 ns and 53.8 ± 5.8 ns, respectively. Conversely, the transition from state 6 to state 3 and state 4 takes much longer, requiring 1393.1 ± 108.4 ns and 1557.8 ± 223.1 ns, respectively. In the E219K variant, the hydrogen bond is broken in state 1 and state 5, and the transition to state 6, where the hydrogen bond is formed, takes 1621.4 ± 415.5 ns and 4360.4 ± 972.0 ns, respectively. Conversely, the transition from state 6 to state 1 and state5 takes 3408.7 ± 724.0 ns and 11162.4 ± 3016.3 ns. Therefore, V211A, V211G, and E219G variants can readily facilitate the formation and disruption of the hydrogen bond N287(ND2)-N314(OD1), while the transition between G214R and E219K will be harder.
4. Conclusions
The investigation of the effects of substitutions in the PDC-3 β-lactamase has provided valuable information on the enzyme dynamics. This study, which is in excellent agreement with experimental observations, highlights the importance of substitutions, that can have a significant impact on the stability and flexibility of the Ω-loop and R2-loop, both of which are critical for proper β-lactamase function. Specifically, the G214A, G214R, E214G, and Y221A variants, as well as the wild-type PDC-3, exhibit high flexibility in the Ω-loop, while the V211A and E219G variants show the highest flexibility in the R2-loop. The substitutions of E219K and Y221A significantly alter the shapes and size of the active site, leading to changes in the conformations of S64 and K67 which might facilitate the proton transfer for the catalysis of hydrolyzing cephalosporins. We propose this plausible mechanism of proton shuttling in E219K and Y221A variants to be similar to that observed in class A b-lactamases, but yet to be reported in class C enzymes. In addition, the loss of the hydrogen bond K67(NZ)-G220(O) potentially affects the binding of substrate in the active site of PDC-3. It is worth emphasizing that the active site pockets of the E219K and Y221A variants have the largest volume, which could have significant implications for the enzymatic activity. The formation of Y150(N)-A292(O) and N287(ND2)-N314(OD1) interactions might play a critical role in stabilizing the R2-loop. In addition, the loss of these two hydrogen bonds results in an expansion of the R2 active site pocket. This increase in size could have a significant impact on the binding of b-lactam antibiotics, which are commonly used to treat bacterial infections. Overall, the findings in this study provide significant insights into the dynamics of the PDC-3 b-lactamase, revealing the critical roles played by the W-loop and R2-loop in its function. The knowledge gained from this study will aid in the design of new, more effective antibiotics for treating bacterial infections by exploiting these interactions.
Supplementary Material
Acknowledgements
Research reported herein was supported in part by funds the National Institute of Allergy and Infectious Diseases of the National Institutes of Health under Award Number R01AI063517 to RAB and SH. The content is solely the responsibility of the authors and does not necessarily represent the official views of the Department of Veterans Affairs or the National Institutes of Health.
Competing Interests
RAB reports grants from Entasis, Merck, Wockhardt, Shionogi, and Venatorx outside the submitted work. All the other authors have no conflict of interest.
Data Availability
All files required to run the simulations (topology, coordinates, input), processed trajectories (xtc), corresponding coordinates (pdb), metastable PDB files for each system described in this manuscript can be downloaded from the DOI 10.57760/sciencedb.15876
References
- ABAGYAN R., TOTROV M. & KUZNETSOV D. 1994. ICM?A new method for protein modeling and design: Applications to docking and structure prediction from the distorted native conformation. Journal of Computational Chemistry, 15, 488–506. [Google Scholar]
- BARENDREGT N. W., JOSIC K. & KILPATRICK Z. P. 2019. Analyzing dynamic decision-making models using Chapman-Kolmogorov equations. J Comput Neurosci, 47, 205–222. [DOI] [PMC free article] [PubMed] [Google Scholar]
- BARNES M. D., TARACILA M. A., RUTTER J. D., BETHEL C. R., GALDADAS I., HUJER A. M., CASELLI E., PRATI F., DEKKER J. P., PAPP-WALLACE K. M., HAIDER S. & BONOMO R. A. 2018. Deciphering the Evolution of Cephalosporin Resistance to Ceftolozane-Tazobactam in Pseudomonas aeruginosa. mBio, 9. [DOI] [PMC free article] [PubMed] [Google Scholar]
- BORNOT A., ETCHEBEST C. & DE BREVERN A. G. 2011. Predicting protein flexibility through the prediction of local structures. Proteins, 79, 839–52. [DOI] [PMC free article] [PubMed] [Google Scholar]
- BOWMAN G. R., HUANG X. & PANDE V. S. 2009. Using generalized ensemble simulations and Markov state models to identify conformational states. Methods, 49, 197–201. [DOI] [PMC free article] [PubMed] [Google Scholar]
- CERUTTI D. S., DUKE R. E., DARDEN T. A. & LYBRAND T. P. 2009. Staggered Mesh Ewald: An extension of the Smooth Particle-Mesh Ewald method adding great versatility. J Chem Theory Comput, 5, 2322. [DOI] [PMC free article] [PubMed] [Google Scholar]
- CHAUDHRY S. B., VEVE M. P. & WAGNER J. L. 2019. Cephalosporins: A Focus on Side Chains and beta-Lactam Cross-Reactivity. Pharmacy (Basel), 7. [DOI] [PMC free article] [PubMed] [Google Scholar]
- COLQUE C. A., ALBARRACIN ORIO A. G., TOMATIS P. E., DOTTA G., MORENO D. M., HEDEMANN L. G., HICKMAN R. A., SOMMER L. M., FELIZIANI S., MOYANO A. J., BONOMO R. A., H K. J., MOLIN S., VILA A. J. & SMANIA A. M. 2022. Longitudinal Evolution of the Pseudomonas-Derived Cephalosporinase (PDC) Structure and Activity in a Cystic Fibrosis Patient Treated with beta-Lactams. mBio, 13, e0166322. [DOI] [PMC free article] [PubMed] [Google Scholar]
- CRICHLOW G. V., KUZIN A. P., NUKAGA M., MAYAMA K., SAWAI T. & KNOX J. R. 1999. Structure of the extended-spectrum class C beta-lactamase of Enterobacter cloacae GC1, a natural mutant with a tandem tripeptide insertion. Biochemistry, 38, 10256–61. [DOI] [PubMed] [Google Scholar]
- CRICHLOW G. V., NUKAGA M., DOPPALAPUDI V. R., BUYNAK J. D. & KNOX J. R. 2001. Inhibition of class C beta-lactamases: structure of a reaction intermediate with a cephem sulfone. Biochemistry, 40, 6233–9. [DOI] [PubMed] [Google Scholar]
- CURRAN C. S., BOLIG T. & TORABI-PARIZI P. 2018. Mechanisms and Targeted Therapies for Pseudomonas aeruginosa Lung Infection. Am J Respir Crit Care Med, 197, 708–727. [DOI] [PMC free article] [PubMed] [Google Scholar]
- DOERR S., HARVEY M. J., NOE F. & DE FABRITIIS G. 2016. HTMD: High-Throughput Molecular Dynamics for Molecular Discovery. J Chem Theory Comput, 12, 1845–52. [DOI] [PubMed] [Google Scholar]
- FEENSTRA K. A., HESS B. & BERENDSEN H. J. C. 1999. Improving efficiency of large time-scale molecular dynamics simulations of hydrogen-rich systems. Journal of Computational Chemistry, 20, 786–798. [DOI] [PubMed] [Google Scholar]
- GUERRA J. V. D. S., RIBEIRO FILHO H. V., BORTOT L. O., HONORATO R. V., PEREIRA J. G. D. C. & LOPES-DE-OLIVEIRA P. S. 2020. ParKVFinder: A thread-level parallel approach in biomolecular cavity detection. SoftwareX, 12. [Google Scholar]
- HARVEY M. J., GIUPPONI G. & FABRITIIS G. D. 2009. ACEMD: Accelerating Biomolecular Dynamics in the Microsecond Time Scale. J Chem Theory Comput, 5, 1632–9. [DOI] [PubMed] [Google Scholar]
- HOLLINGSWORTH S. A. & DROR R. O. 2018. Molecular Dynamics Simulation for All. Neuron, 99, 1129–1143. [DOI] [PMC free article] [PubMed] [Google Scholar]
- HORCAJADA J. P., MONTERO M., OLIVER A., SORLI L., LUQUE S., GOMEZ-ZORRILLA S., BENITO N. & GRAU S. 2019. Epidemiology and Treatment of Multidrug-Resistant and Extensively Drug-Resistant Pseudomonas aeruginosa Infections. Clin Microbiol Rev, 32. [DOI] [PMC free article] [PubMed] [Google Scholar]
- HUSIC B. E. & PANDE V. S. 2018. Markov State Models: From an Art to a Science. J Am Chem Soc, 140, 2386–2396. [DOI] [PubMed] [Google Scholar]
- JACOBY G. A. 2009. AmpC beta-lactamases. Clin Microbiol Rev, 22, 161–82, Table of Contents. [DOI] [PMC free article] [PubMed] [Google Scholar]
- JURADO-MARTIN I., SAINZ-MEJIAS M. & MCCLEAN S. 2021. Pseudomonas aeruginosa: An Audacious Pathogen with an Adaptable Arsenal of Virulence Factors. Int J Mol Sci, 22. [DOI] [PMC free article] [PubMed] [Google Scholar]
- KERR K. G. & SNELLING A. M. 2009. Pseudomonas aeruginosa: a formidable and ever-present adversary. J Hosp Infect, 73, 338–44. [DOI] [PubMed] [Google Scholar]
- LAHIRI S. D., MANGANI S., DURAND-REVILLE T., BENVENUTI M., DE LUCA F., SANYAL G. & DOCQUIER J. D. 2013. Structural insight into potent broad-spectrum inhibition with reversible recyclization mechanism: avibactam in complex with CTX-M-15 and Pseudomonas aeruginosa AmpC beta-lactamases. Antimicrob Agents Chemother, 57, 2496–505. [DOI] [PMC free article] [PubMed] [Google Scholar]
- LAHIRI S. D., WALKUP G. K., WHITEAKER J. D., PALMER T., MCCORMACK K., TANUDRA M. A., NASH T. J., THRESHER J., JOHNSTONE M. R., HAJEC L., LIVCHAK S., MCLAUGHLIN R. E. & ALM R. A. 2015. Selection and molecular characterization of ceftazidime/avibactam-resistant mutants in Pseudomonas aeruginosa strains containing derepressed AmpC. J Antimicrob Chemother, 70, 1650–8. [DOI] [PubMed] [Google Scholar]
- LIMA L. M., SILVA B., BARBOSA G. & BARREIRO E. J. 2020. beta-lactam antibiotics: An overview from a medicinal chemistry perspective. Eur J Med Chem, 208, 112829. [DOI] [PubMed] [Google Scholar]
- MAIER J. A., MARTINEZ C., KASAVAJHALA K., WICKSTROM L., HAUSER K. E. & SIMMERLING C. 2015. ff14SB: Improving the Accuracy of Protein Side Chain and Backbone Parameters from ff99SB. J Chem Theory Comput, 11, 3696–713. [DOI] [PMC free article] [PubMed] [Google Scholar]
- MALHOTRA S., HAYES D. JR. & WOZNIAK D. J. 2019. Cystic Fibrosis and Pseudomonas aeruginosa: the Host-Microbe Interface. Clin Microbiol Rev, 32. [DOI] [PMC free article] [PubMed] [Google Scholar]
- MARTINEZ L. 2015. Automatic identification of mobile and rigid substructures in molecular dynamics simulations and fractional structural fluctuation analysis. PLoS One, 10, e0119264. [DOI] [PMC free article] [PubMed] [Google Scholar]
- MCGIBBON R. T., BEAUCHAMP K. A., HARRIGAN M. P., KLEIN C., SWAILS J. M., HERNANDEZ C. X., SCHWANTES C. R., WANG L. P., LANE T. J. & PANDE V. S. 2015. MDTraj: A Modern Open Library for the Analysis of Molecular Dynamics Trajectories. Biophys J, 109, 1528–32. [DOI] [PMC free article] [PubMed] [Google Scholar]
- MEROUEH S. O., FISHER J. F., SCHLEGEL H. B. & MOBASHERY S. 2005. Ab initio QM/MM study of class A beta-lactamase acylation: dual participation of Glu166 and Lys73 in a concerted base promotion of Ser70. J Am Chem Soc, 127, 15397–407. [DOI] [PubMed] [Google Scholar]
- MORA-OCHOMOGO M. & LOHANS C. T. 2021. beta-Lactam antibiotic targets and resistance mechanisms: from covalent inhibitors to substrates. RSC Med Chem, 12, 1623–1639. [DOI] [PMC free article] [PubMed] [Google Scholar]
- MUNITA J. M. & ARIAS C. A. 2016. Mechanisms of Antibiotic Resistance. Microbiol Spectr, 4. [DOI] [PMC free article] [PubMed] [Google Scholar]
- NORDMANN P. & MAMMERI H. 2007. Extended-spectrum cephalosporinases: structure, detection and epidemiology. Future Microbiol, 2, 297–307. [DOI] [PubMed] [Google Scholar]
- OLSSON M. H., SONDERGAARD C. R., ROSTKOWSKI M. & JENSEN J. H. 2011. PROPKA3: Consistent Treatment of Internal and Surface Residues in Empirical pKa Predictions. J Chem Theory Comput, 7, 525–37. [DOI] [PubMed] [Google Scholar]
- PANG Z., RAUDONIS R., GLICK B. R., LIN T. J. & CHENG Z. 2019. Antibiotic resistance in Pseudomonas aeruginosa: mechanisms and alternative therapeutic strategies. Biotechnol Adv, 37, 177–192. [DOI] [PubMed] [Google Scholar]
- PEMBERTON O. A., NOOR R. E., KUMAR M. V. V., SANISHVILI R., KEMP M. T., KEARNS F. L., WOODCOCK H. L., GELIS I. & CHEN Y. 2020. Mechanism of proton transfer in class A beta-lactamase catalysis and inhibition by avibactam. Proc Natl Acad Sci U S A, 117, 5818–5825. [DOI] [PMC free article] [PubMed] [Google Scholar]
- PENG J.-H., WANG W., YU Y.-Q., GU H.-L. & HUANG X. 2018. Clustering algorithms to analyze molecular dynamics simulation trajectories for complex chemical and biological systems. Chinese Journal of Chemical Physics, 31, 404–420. [Google Scholar]
- PEREZ-HERNANDEZ G. & NOE F. 2016. Hierarchical Time-Lagged Independent Component Analysis: Computing Slow Modes and Reaction Coordinates for Large Molecular Systems. J Chem Theory Comput, 12, 6118–6129. [DOI] [PubMed] [Google Scholar]
- PEREZ-INESTROSA E., SUAU R., MONTANEZ M. I., RODRIGUEZ R., MAYORGA C., TORRES M. J. & BLANCA M. 2005. Cephalosporin chemical reactivity and its immunological implications. Curr Opin Allergy Clin Immunol, 5, 323–30. [DOI] [PubMed] [Google Scholar]
- PHILIPPON A., ARLET G., LABIA R. & IORGA B. I. 2022. Class C beta-Lactamases: Molecular Characteristics. Clin Microbiol Rev, 35, e0015021. [DOI] [PMC free article] [PubMed] [Google Scholar]
- POLIZZI N. F., THERIEN M. J. & BERATAN D. N. 2016. Mean First-Passage Times in Biology. Isr J Chem, 56, 816–824. [DOI] [PMC free article] [PubMed] [Google Scholar]
- POWERS R. A. & SHOICHET B. K. 2002. Structure-based approach for binding site identification on AmpC beta-lactamase. J Med Chem, 45, 3222–34. [DOI] [PubMed] [Google Scholar]
- PRABANTU V. M., GADIYARAM V., VISHVESHWARA S. & SRINIVASAN N. 2022. Understanding structural variability in proteins using protein structural networks. Curr Res Struct Biol, 4, 134–145. [DOI] [PMC free article] [PubMed] [Google Scholar]
- REYNOLDS D. & KOLLEF M. 2021. The Epidemiology and Pathogenesis and Treatment of Pseudomonas aeruginosa Infections: An Update. Drugs, 81, 2117–2131. [DOI] [PMC free article] [PubMed] [Google Scholar]
- RODRIGUEZ-MARTINEZ J. M., POIREL L. & NORDMANN P. 2010. Genetic and functional variability of AmpC-type beta-lactamases from Acinetobacter baumannii. Antimicrob Agents Chemother, 54, 4930–3. [DOI] [PMC free article] [PubMed] [Google Scholar]
- RUEDAS-LOPEZ A., ALONSO-GARCIA I., LASARTE-MONTERRUBIO C., GUIJARRO-SANCHEZ P., GATO E., VAZQUEZ-UCHA J. C., VALLEJO J. A., FRAILE-RIBOT P. A., FERNANDEZ-PEREZ B., VELASCO D., GUTIERREZ-URBON J. M., OVIANO M., BECEIRO A., GONZALEZ-BELLO C., OLIVER A., ARCA-SUAREZ J. & BOU G. 2022. Selection of AmpC beta-Lactamase Variants and Metallo-beta-Lactamases Leading to Ceftolozane/Tazobactam and Ceftazidime/Avibactam Resistance during Treatment of MDR/XDR Pseudomonas aeruginosa Infections. Antimicrob Agents Chemother, 66, e0206721. [DOI] [PMC free article] [PubMed] [Google Scholar]
- SCHERER M. K., TRENDELKAMP-SCHROER B., PAUL F., PEREZ-HERNANDEZ G., HOFFMANN M., PLATTNER N., WEHMEYER C., PRINZ J. H. & NOE F. 2015. PyEMMA 2: A Software Package for Estimation, Validation, and Analysis of Markov Models. J Chem Theory Comput, 11, 5525–42. [DOI] [PubMed] [Google Scholar]
- SPAGNOLO A. M., SARTINI M. & CRISTINA M. L. 2021. Pseudomonas aeruginosa in the healthcare facility setting. Reviews in Medical Microbiology, 32, 169–175. [Google Scholar]
- TACCONELLI E., CARRARA E., SAVOLDI A., HARBARTH S., MENDELSON M., MONNET D. L., PULCINI C., KAHLMETER G., KLUYTMANS J., CARMELI Y., OUELLETTE M., OUTTERSON K., PATEL J., CAVALERI M., COX E. M., HOUCHENS C. R., GRAYSON M. L., HANSEN P., SINGH N., THEURETZBACHER U., MAGRINI N. & GROUP W. H. O. P. P. L. W. 2018. Discovery, research, and development of new antibiotics: the WHO priority list of antibiotic-resistant bacteria and tuberculosis. Lancet Infect Dis, 18, 318–327. [DOI] [PubMed] [Google Scholar]
- TRENDELKAMP-SCHROER B. & NOE F. 2013. Efficient Bayesian estimation of Markov model transition matrices with given stationary distribution. J Chem Phys, 138, 164113. [DOI] [PubMed] [Google Scholar]
- TRIPATHI R. & NAIR N. N. 2013. Mechanism of acyl-enzyme complex formation from the Henry-Michaelis complex of class C beta-lactamases with beta-lactam antibiotics. J Am Chem Soc, 135, 14679–90. [DOI] [PubMed] [Google Scholar]
- TRIPATHI R. & NAIR N. N. 2016. Deacylation Mechanism and Kinetics of Acyl-Enzyme Complex of Class C beta-Lactamase and Cephalothin. J Phys Chem B, 120, 2681–90. [DOI] [PubMed] [Google Scholar]
Associated Data
This section collects any data citations, data availability statements, or supplementary materials included in this article.
Supplementary Materials
Data Availability Statement
All files required to run the simulations (topology, coordinates, input), processed trajectories (xtc), corresponding coordinates (pdb), metastable PDB files for each system described in this manuscript can be downloaded from the DOI 10.57760/sciencedb.15876