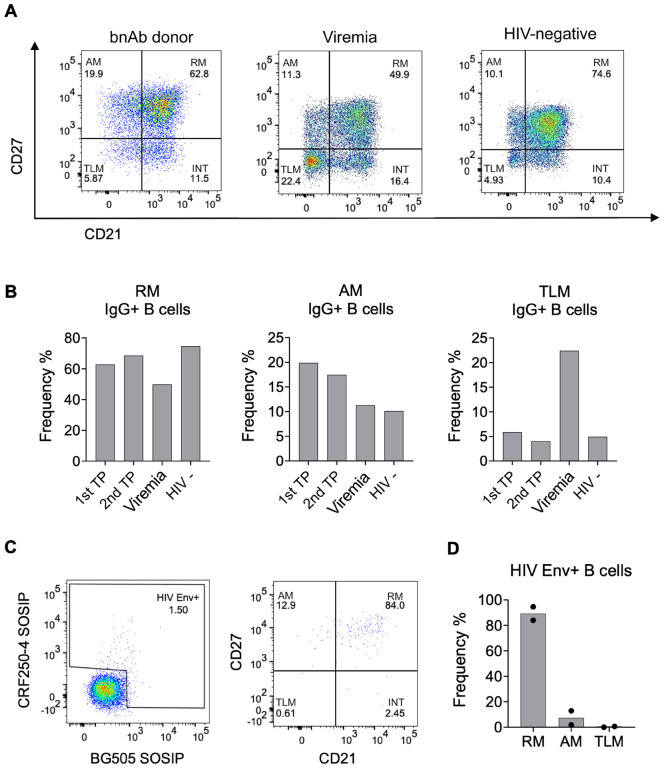
Figure 3: B Cell surface profiles of bnAb donor do not show expected HIV-1-associated dysfunction.
(A) FACS analysis of CD27 and CD21 on IgG+ B cells (CD19+ IgG+ IgM-) from PBMC isolated from the bnAb donor T125 (1st timepoint (TP)), an individual living with HIV-1 with detectable viraemia and an HIV-negative donor.
(B) Percentage frequency of resting memory (RM), activated memory (AM) and tissue-like memory (TLM) IgG+ B cells in the bnAb donor T125 1st TP, second TP four months later (2nd TP), donor with detectable HIV-1 Viremia and HIV-negative donor PBMC.
(C) Percentage of HIV-1 Env+ IgG+ B cells from the bnAb donor T125 1st TP PBMC identified by flow cytometry based on the ability to bind fluorescently labelled CRF250–4 and/or BG505 SOSIP, followed by analysis of their CD27 and CD21 surface expression.
(D) Percentage frequency of resting memory (RM), activated memory (AM) and tissue-like memory (TLM) HIV-1 Env+ IgG+ B cells in the bnAb donor T125, with the mean frequency of both TP plotted.

