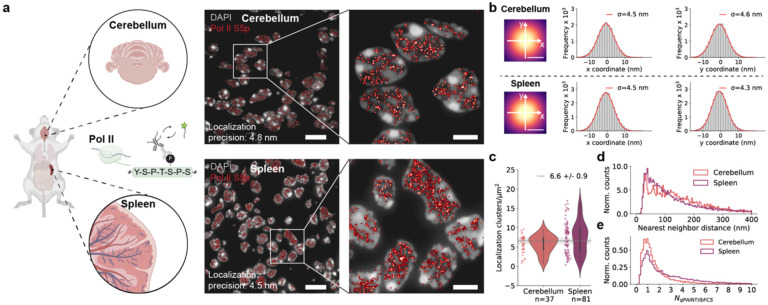
Figure 3 |. Resolution and kinetic enhancement translate to tokPAINT tissue imaging.
a Tissue blocks of mouse cerebellum and spleen were processed for Tokuyasu sectioning and subsequently stained for Pol II S5p prior to imaging. Top: tokPAINT image of region of mouse cerebellum (NeNA localization precision: 4.8 nm) and zoom-in to white box. Bottom: tokPAINT image of a region of mouse spleen (NeNA localization precision: 4.5 nm) and zoom-in to white box. b Comparison of center-of-mass aligned localization clusters for cerebellum and spleen tokPAINT data sets (top and bottom, respectively). The histograms show the distribution of localizations along the x and y axis (white arrows) and give the standard deviation obtained by a Gaussian fit (red curve). c Violin plot comparing number of Pol II S5p localization clusters/μm2 between cerebellum and spleen. Grey line and shaded area show mean and standard deviation, respectively, between both data sets. d Nearest-neighbor distance distributions measured in tokPAINT images of mouse cerebellum and spleen. e qPAINT distributions measured in tokPAINT images of mouse cerebellum and spleen. Scale bars, 10 μm in (a), 3 μm in zoom-ins in (a) and 5 nm in (b).

