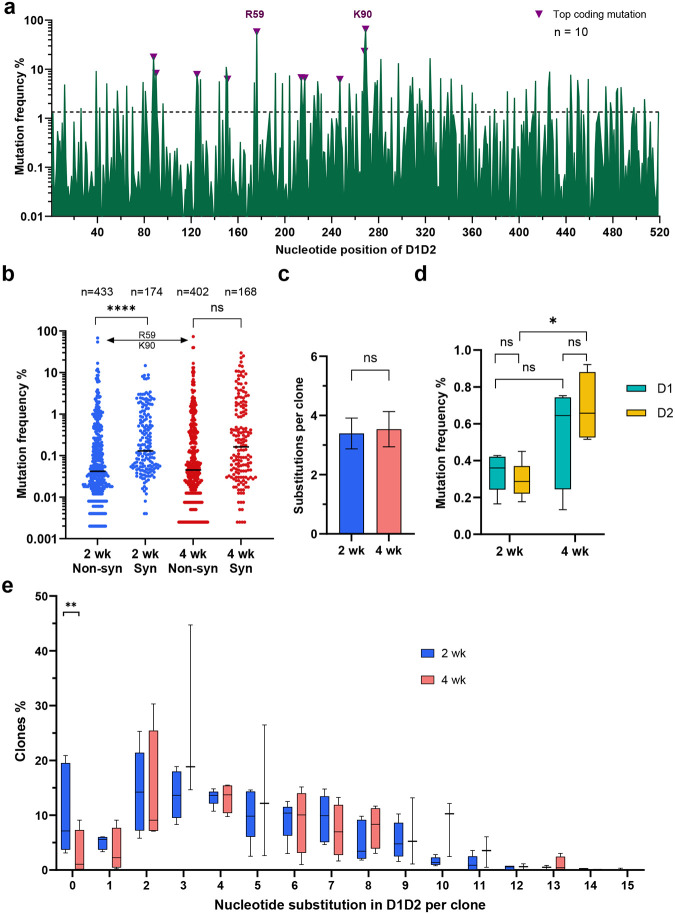
Fig. 4. D1D2-expressing B cells hypermutated and class switched in vivo.
a Nucleotide mutation frequency across the D1D2-encoding region. mRNA isolated from CD45+ IgG+ gp120-binding B cells from each of 10 mice was analyzed by NGS and the mean frequency of nucleotide mutations is plotted for each position. Triangles represent the most frequent coding mutations. Codons for R59 and K90 are indicated. b Distribution of synonymous (Syn) and non-synonymous (Non-syn) mutation frequency across D1D2. Each dot represents the mutation frequency at one nucleotide position, averaged on five mice in each group. The top two dots indicate the nucleotide mutations leading to R59 and K90 mutations. Line indicates the median. c Average number of accumulated mutations per unique sequence. Significance was determined by two-tailed unpair t test. d The frequency of synonymous mutations within domains 1 (D1) and 2 (D2) for mice immunized at two-week (2 wk) and four-week (4 wk) intervals. The center line indicates mean, and boxes denote quartile range. Repeated measure mixed effects analysis with H-Šídák’s multiple comparisons (*p < 0.05). e Distribution of accumulated nucleotide mutations per unique D1D2 sequence. The center line indicates mean, and boxes denote quartile range. Statistical significance in b, e was determined by mixed effects analysis with H-Šídák’s multiple comparisons (*p < 0.05; **p < 0.01; ***p < 0.001; ****p < 0.0001).

