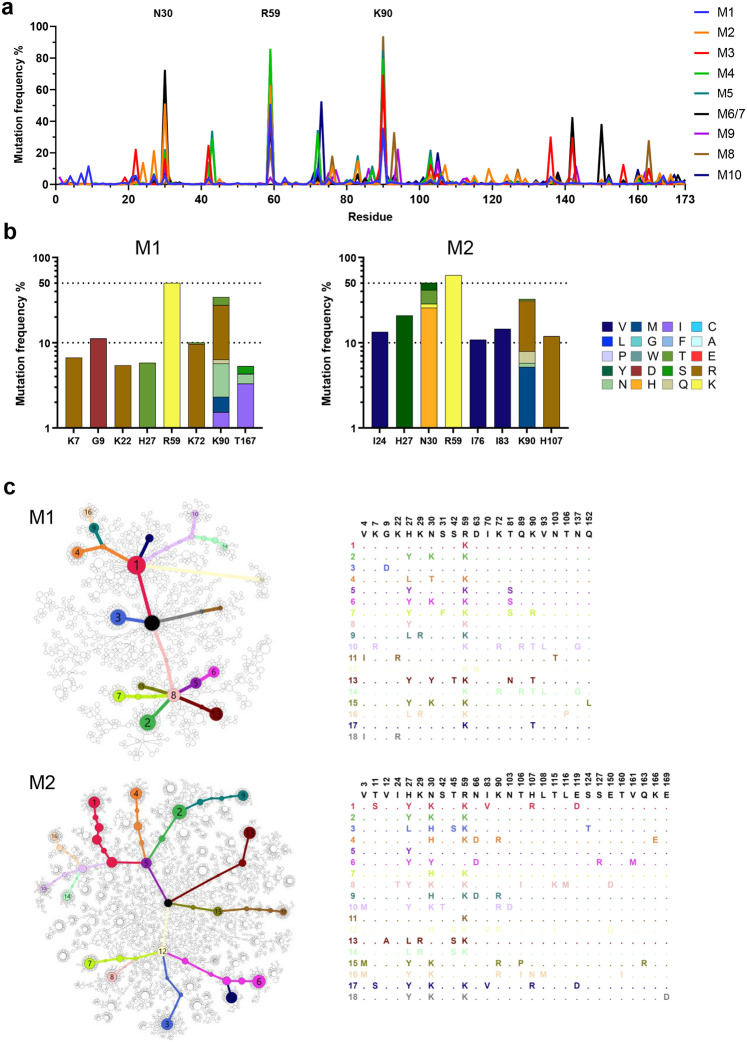
Fig. 5. Diverse and convergent amino-acid mutations in engrafted mice.
a The frequency of amino acid changes across D1D2 sequences from each mouse (M1 through M10). Three amino acids with the highest mutation rate are labeled. M6 and M7 were combined in sequencing analysis. b Amino acid changes found in the eight most frequently mutated D1D2 residues from the indicated mice immunized at two-week intervals (M1, M2) are represented. The data for remaining mice are shown in Extended Data Fig. 5. c Minimum spanning trees of D1D2 sequences from individual mice. Each tree presents the inferred lineage and all amino-acid mutations found in M1 and M2. The central black dot represents the inferred ancestral sequence which corresponds to the input sequence. Each circle indicates a distinct amino-acid sequence. Circle size is proportional to the number distinct nucleotide sequences with the same translation. Colored circles mark translations encoded by the eighteen largest number of distinct sequences, with the rank order indicated by number. Branch length corresponds to evolutionary distance, defined as the number of amino-acid differences. The figures for the remaining mice are provided in Extended Data Fig. 6.

