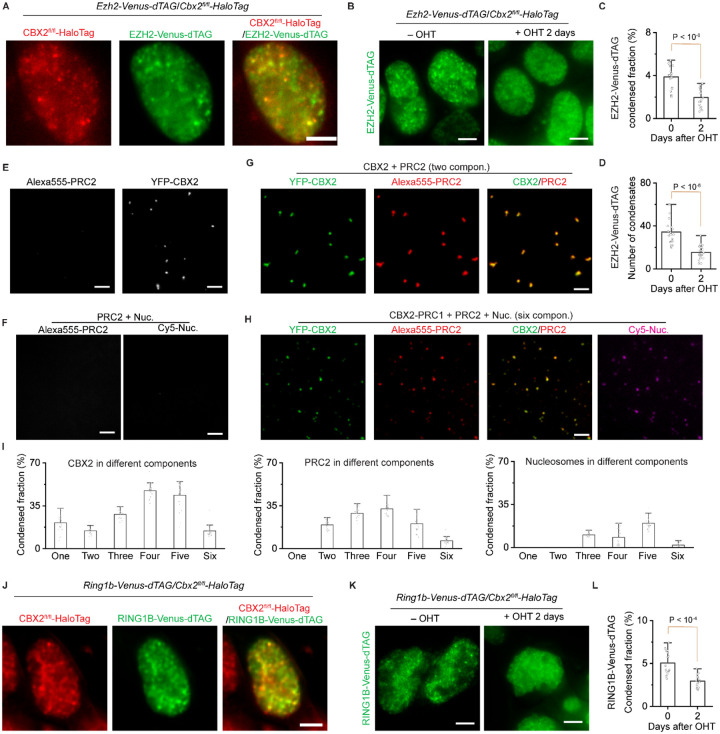
Figure 3. Sparse CBX2 nucleates Polycomb condensates.
(A) Live-cell epifluorescence images of CBX2-HaloTag (red) and EZH2-Venus-dTAG (green) in Ezh2-Venus-dTAG/Cbx2fl/fl-HaloTag dual knockin mESC lines. Overlay image is shown. Scale bar, 5.0 μm.
(B) Live-cell epifluorescence images of EZH2-Venus-dTAG in Ezh2-Venus-dTAG/Cbx2fl/fl-HaloTag dual knockin mESCs before and after depletion of CBX2. CBX2 was depleted by administrating OHT for two days. Scale bar, 5.0 μm.
(C) Bar overlap plot of the condensed fraction of EZH2-Venus-dTAG quantified from Figure 3B. P value, student’s t-test with two-tailed distribution and two-sample unequal variance.
(D) Bar overlap plot of the number of condensates of EZH2-Venus-dTAG quantified from Figure 3B. P value, student’s t-test with two-tailed distribution and two-sample unequal variance.
(E) Epifluorescence images of a one-component system of YFP-CBX2 or Alexa555-labelled PRC2 consisted of EZH2, SUZ12, EED, and RbAp46/48. When defining the number of components, solvent was not counted. For the sake of simplicity, PRC2 was defined as one component. YFP-CBX2 formed condensates but Alexa555-PRC2 did not form. YFP-CBX2 was 500 nM and Alexa555-PRC2 was 50 nM. Scale bar, 5.0 μm.
(F) Epifluorescence images of a two-component system of Alexa555-PRC2 and Cy5-nucleosomes. Alexa555-PRC2 and Cy5-nucleosomes were mixed and did not appear as condensates. Alexa555-PRC2 was 50 nM and Cy5-nucleosomes were 200 nM. Scale bar, 5.0 μm.
(G) Epifluorescence images of condensates of a two component-system of YFP-CBX2 and Alexa555-labelled PRC2. YFP-CBX2 and Alexa555-PRC2 were mixed. PRC2 was enriched within YFP-CBX2 condensates. YFP-CBX2 was 500 nM and Alexa555-PRC2 was 50 nM. Scale bar, 5.0 μm.
(H) Epifluorescence images of condensates of a six-component system of YFP-CBX2, Alexa555-PRC2, and Cy5-nucleosomes. The system includes CBX2 (500 nM), RING1B (500 nM), MEL18 (500 nM), PHC1 (500 nM), nucleosomes (200 nM), and PRC2 (50 nM). Individual and overlay images of CBX2 and PRC2 were shown. Images of nucleosomes were also shown. Scale bar, 5.0 μm.
(I) Bar overlap plot of the condensed fraction of CBX2, PRC2, and nucleosomes quantified from Figure S3G. The condensed fraction was from the systems with different components.
(J) Live-cell epifluorescence images of CBX2-HaloTag (red) and RING1B-Venus-dTAG (green) in Ring1b-Venus-dTAG/Cbx2fl/fl-HaloTag dual knockin mESC lines. Overlay images were shown. Scale bar, 5.0 μm.
(K) Live-cell epifluorescence images of RING1B-Venus-dTAG in Ring1b-Venus-dTAG/Cbx2fl/fl-HaloTag dual knockin mESCs upon the depletion of CBX2. CBX2 was depleted by administrating OHT for two days. Scale bar, 5.0 μm.
(L) Bar overlap plot of the condensed fraction of RING1B-Venus-dTAG quantified from Figure 3K. P value, student’s t-test with two-tailed distribution and two-sample unequal variance.

