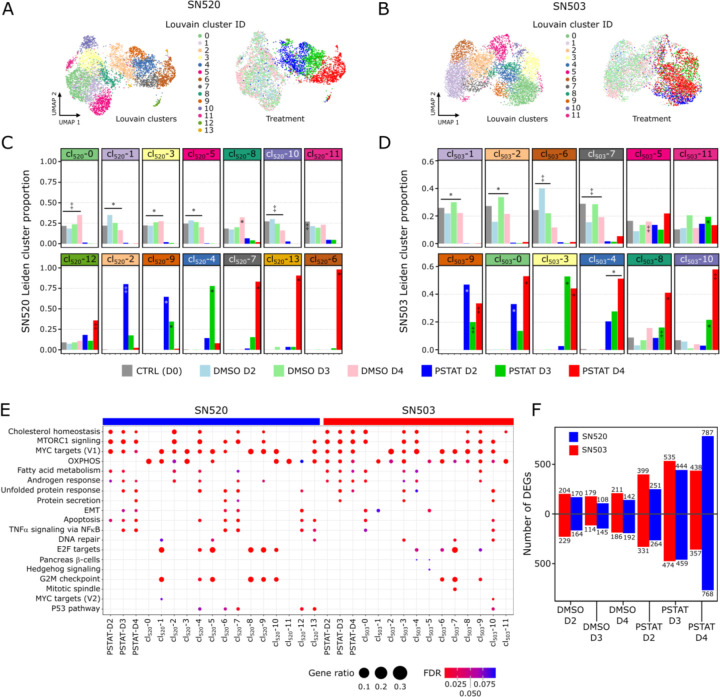
Fig. 3. Differential expression and pathway enrichment analysis reveals underlying processes driving pitavastatin responses.
(A) Heatmap of the top upregulated DEGs, based on FDR p-values, across the 14 Louvain cell clusters (cl) identified in vehicle-control- and pitavastatin-treated SN520 PD-GSCs. Adjacent UMAP plot with treatment annotation (same as Fig 2A) included for reference. (B) Corresponding UMAP plots of scRNA-seq profiles annotated according to Louvain cell cluster (left) and treatment condition (right) as reference. (C) Cell proportions for each Louvain cluster that belong to each treatment condition for SN520. Significant enrichment of treatment condition within Louvain cluster indicated by asterisk (FDR ≤ 0.05) or double dagger (FDR ≤ 1e-05) (D) Cell proportions for each Louvain cluster that belong to each treatment condition for SN503. Significant enrichment notation identical to that used in (D). (E) Dotplot of hallmark gene sets enriched across SN503 and SN520 PD-GSCs, grouped with respect to either drug-treatment duration or Louvain clustering. Dot size represents the ratio of number of upregulated genes associated with a PD-GSC grouping to the number of genes associated with a specific hallmark gene set. Dot colors indicate significance of enrichment (FDR value). (F) Total number of up- and down-regulated DEGs, relative to untreated control (D0) cells, at each treatment time point for SN503 (red) and SN520 (blue).

