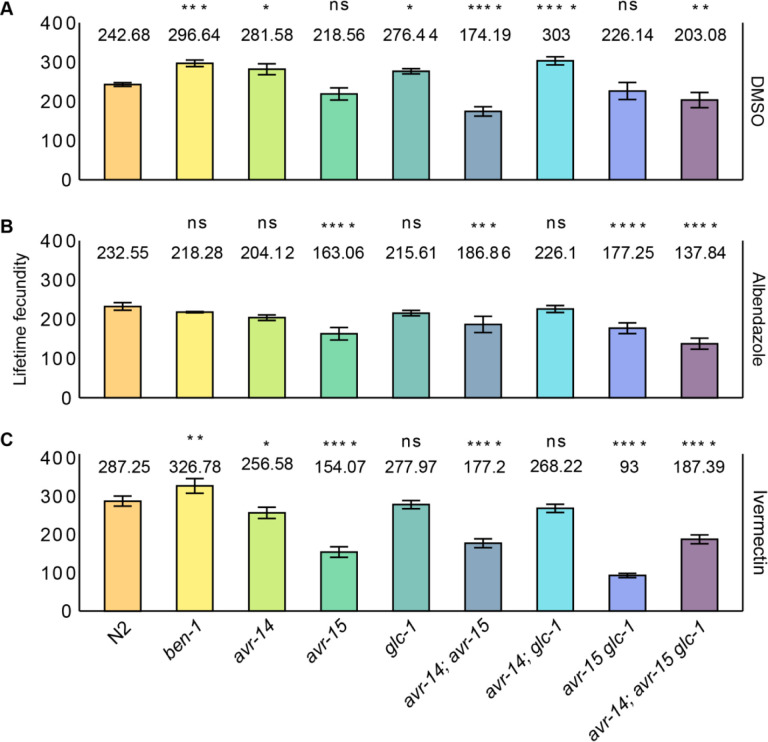
Fig 3. Variation in lifetime fecundity of beta-tubulin and GluCl mutants in the presence of DMSO, albendazole, or ivermectin.
Bar plots for lifetime fecundity, y-axis, for each deletion strain on the x-axis in (A) DMSO, (B) albendazole, and (C) ivermectin are shown. Error bars show the standard deviation of lifetime fecundity among 7 – 10 replicates. The laboratory reference strain, N2, is colored orange. Other strains are colored by genotype. Comparisons of lifetime fecundity between the laboratory reference strain, N2, and all deletion strains are shown. Statistical significance was calculated using Tukey HSD. Significance of each comparison is shown above each comparison pair (p > 0.05 = ns, p < 0.05 = *, p < 0.01 = **, p < 0.001 = ***, p < 0.0001 = ****, Tukey HSD).

