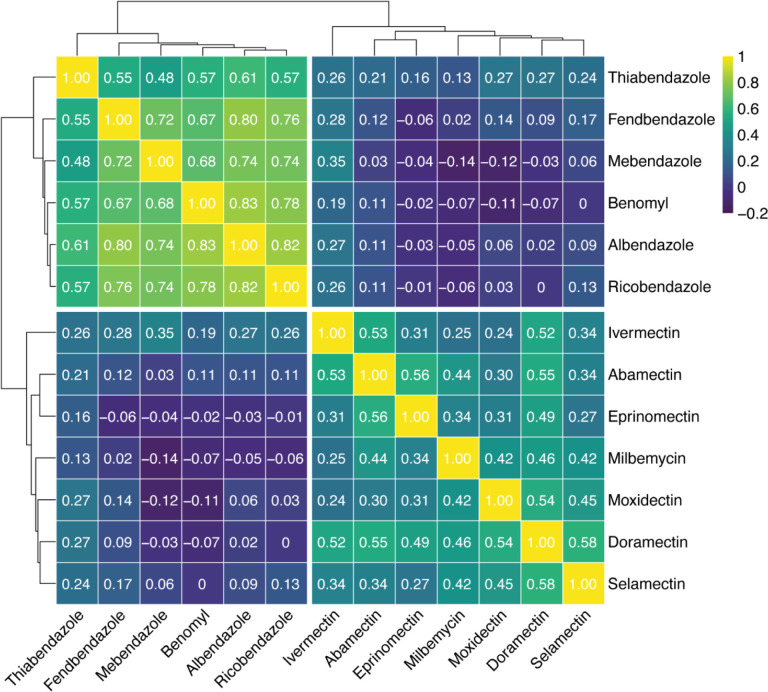
Fig 5. Spearman-rank correlations between 124 wild isolates exposed to BZs and MLs.
Spearman-rank correlations and significance testing were performed between 124 wild isolates exposed to six BZs and seven MLs. The dendrograms were constructed using Euclidean distance and complete linkage metrics and then split into their two largest clusters to show the relationships of similarities between the 124 wild strains exposed to the two major anthelmintic classes. A correlation of 1 signifies the strongest phenotypic correlation (i.e., identical median animal lengths) and a correlation of −0.2 signifies the weakest phenotypic correlation (i.e., dissimilar median animal lengths). Significant correlations (p < 0.05) were recorded (Table S3).

