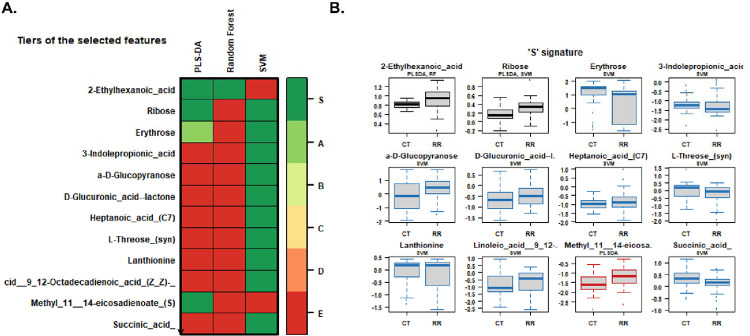
Figure 4: Heatmap and signature of metabolites.
(A) Different tiers of selected features with PLS-DA and SVM random forest to binary classifiers on a scale of red to green showing their intensities to select a smaller subset of metabolites with the highest predictive accuracies. (B) S signatures of different metabolites identified through the classifiers for control and disease patients.

