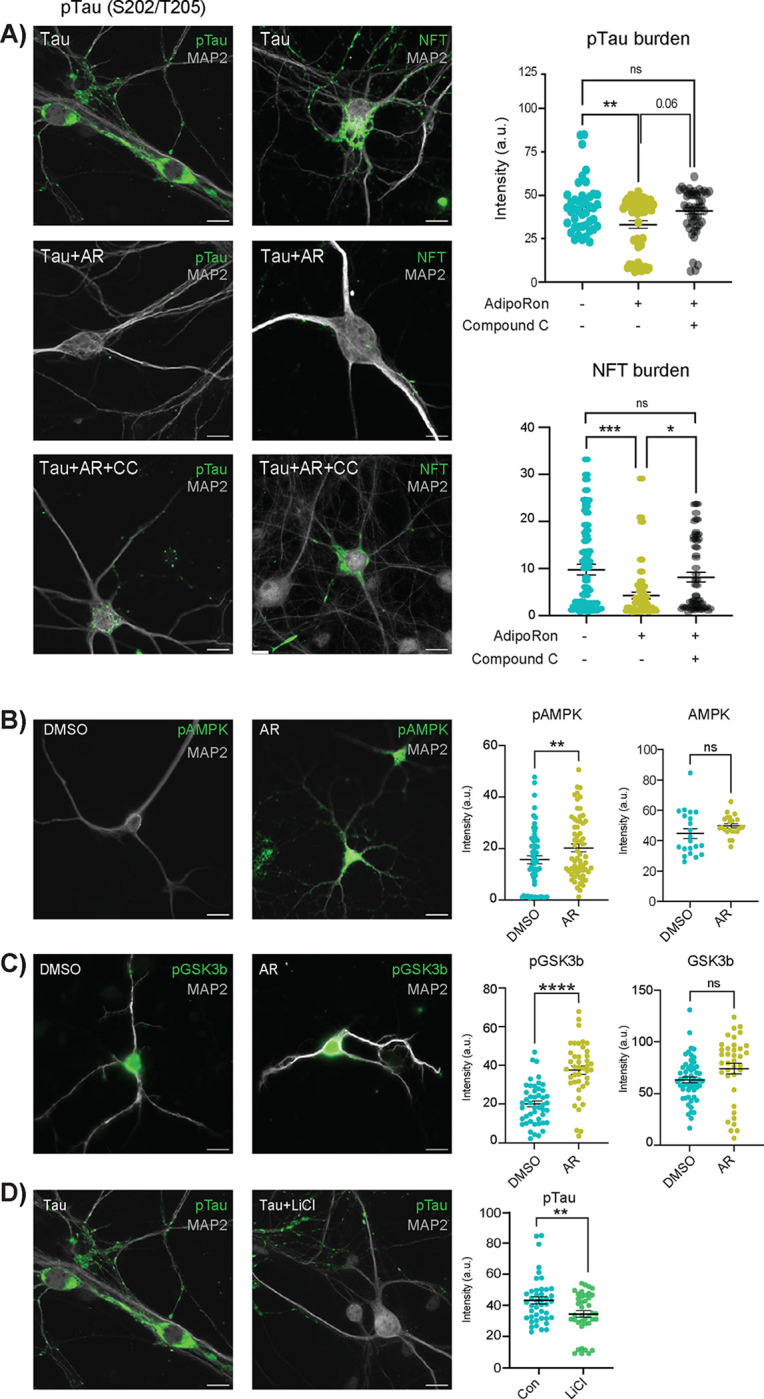
Figure 1: AdipoRon clears phosphorylated tau and NFT via AMPK and GSK3b.

A) Immunofluorescence of phosphorylated Tau (pTau) at S202/T205 and NFT (MC-1 antibody) in Tau neurons following 24-hour treatment with 10 μM AdipoRon ± 8 μM AMPK inhibitor Compound C (pTau, n=43–58 cells; NFT, n=47–72 cells). Scale bar 15 μm). B) Quantification of immunofluorescence images in figure A. Data shown as mean ± SEM. Significance determined by one-way ANOVA with Tukey’s multiple comparison’s test. C) Immunofluorescence detection and quantification of phosphorylated AMPK and total AMPK in Tau neurons following 10-minute treatment with 10 μM AdipoRon. (n=52–54 cells, phosphorylated) (n=21–22 cells, total). Significance determined by Student’s t-test with Welch’s correction. C) Immunofluorescence detection and quantification of phosphorylated GSK3b and total GSK3b in Tau neurons following 10-minute treatment with 10 μM AdipoRon. (n=38–55 cells, phosphorylated) (n=36–54 cells, total) Significance determined by Student’s t-test with Welch’s correction. E) Immunofluorescence detection of pTau after 24-hour treatment with 15mM LiCl (n=40–43 cells). Data shown as mean ± SEM. (*:p<0.5, **:p<0.01, ***:p<0.001, ****:p<0.0001).
