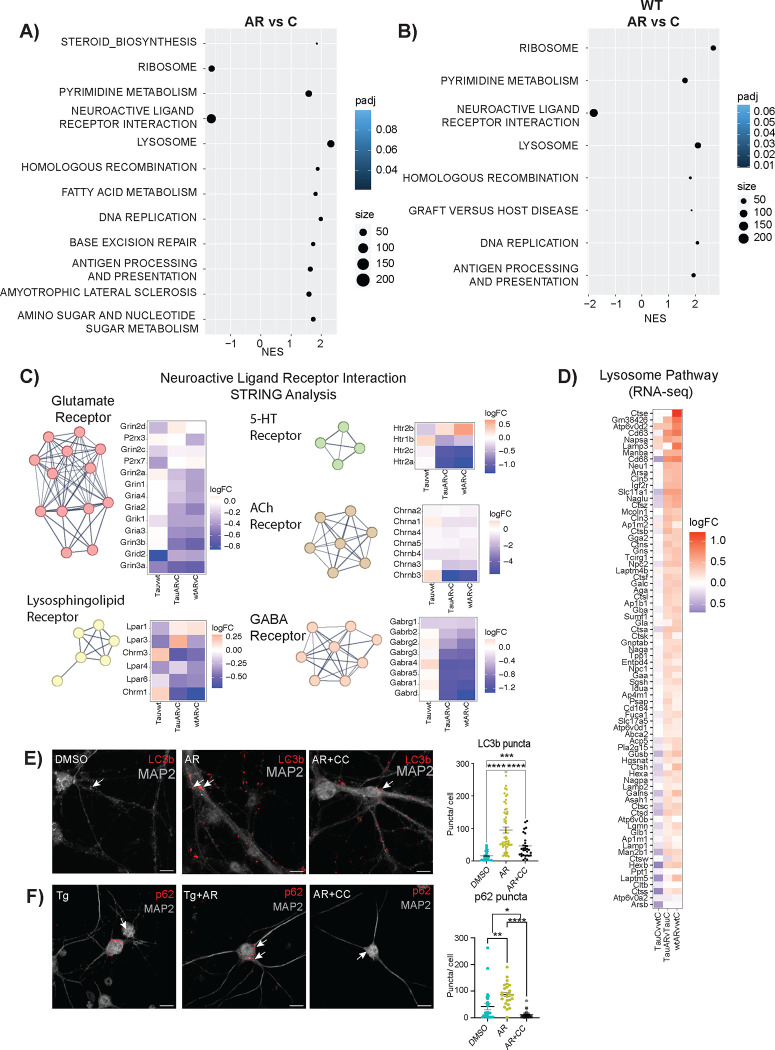
Figure 2: Neuronal transcriptional response to AdipoRon extends beyond metabolic regulation.
A) AR responsive KEGG pathways in Tau neurons. Pathway enrichment determined by GSEA. B) AR responsive KEGG pathways in WT neurons. Pathway enrichment determined by GSEA. C) STRING analysis and heatmap displaying log2FC of Neuroactive Ligand Receptor Interaction Pathway genes from the Tau neurons in response to AR. Genes were clustered using MCL clusterings. The figure shows all clusters with ≥ 4 genes. D) Heatmap of lysosome pathway detected by GSEA in AR-treated Tau and WT neurons. The log2FC of the genes in Tau compared to WT levels was also included. E-F) Immunofluorescent detection and quantification of LC3b and p62 in Tau neurons after 24-hour treatment with 10 μM AdipoRon ± Compound C. Data shown as mean ± SEM. Significance determined by one-way ANOVA with Tukey’s multiple comparison’s test (*:p<0.5, **:p<0.01, ***:p<0.001, ****:p<0.0001) (LC3b,n=33–57 cells p62: n=29–43 cells).

