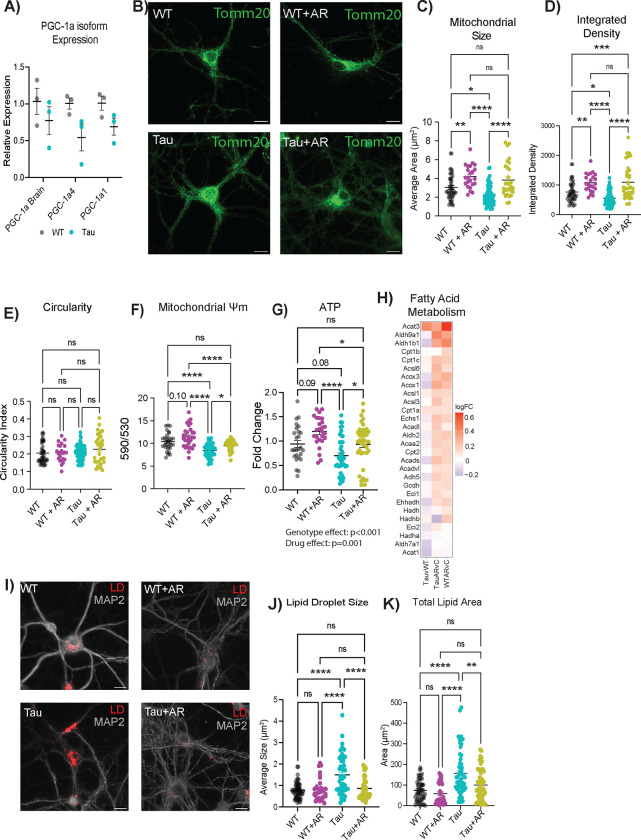
Figure 3: AdipoRon rescues mitochondrial deficits caused by tauopathy.
A) mRNA expression of Ppargc-1a isoforms (n=3). B) Representative images of mitochondria detected with TOMM20 antibody. C–E) Mitochondrial morphology was determined through analysis in ImageJ to detect mitochondrial size (C), integrated density (product of mean intensity and mitochondrial area) (D), and circularity (E) (n=25–40 cells). F) Mitochondrial membrane potential measured by JC-1 2 hours after 10 μM AR treatment (n=30–43). G) Relative ATP concentrations after 12 hours of AdipoRon treatment assessed by ATPlite assay (n=26–48). H) Heatmap of fatty acid metabolism GSEA pathway in AR-treated WT and Tau neurons. The log2FC of the genes in Tau compared to WT levels was also included for reference. I) Representative images of LipidTox dye (scale bar 15uM). J–K) Quantification of lipid droplet size (J), and total area (K) (n=30–53 cells). Data shown as mean ± SEM. Significance determined by multiple Student’s t-test (A) or two-way ANOVA with Sidak’s multiple comparisons test (C–H, J–L) (* p<0.05, ** p<0.01, *** p<0.001, **** p<0.0001).

