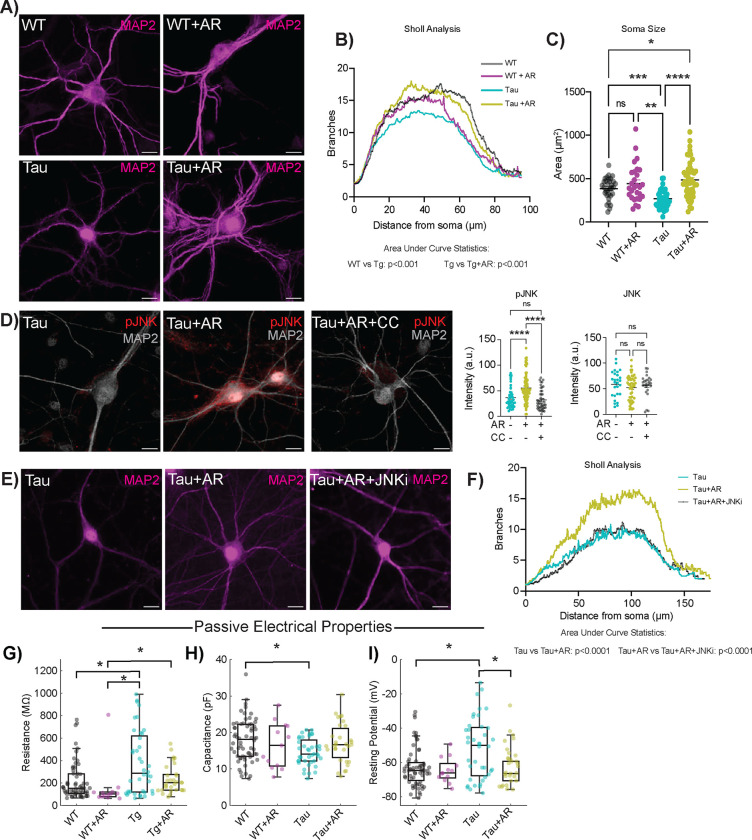
Figure 4: AdipoRon rescues loss of dendritic complexity through activation of JNK.
A) Representative immunodetection images of neuronal membranes detected with microtubule-associated protein 2 (MAP2) antibody. Images shown from WT and Tau neurons treated with 10μM AR or DMSO. B) Quantification of neuronal branch number and distance from soma determined by (n = 25–49). C) Quantification of soma size from the same neurons used for Sholl analysis. D) Representative images and quantification of immunodetection of phosphorylated JNK (pJNK) (n=35–51) and total JNK (n=25) in Tau neurons following 10-minute AR treatment (10 μM). E) Representative images of immunodetection of neuronal membranes (MAP2) in Tau neurons treated with 10μM AR ± 10μM SP600125 (JNK inhibitor). F) Quantification of neuronal branch number and distance from soma determined by Sholl analysis (n=47–51). Sholl analysis data shown as mean only. G–I) Passive electrophysiological parameters of intrinsic excitability of neurons. Resistance (G), capacitance (H), and resting potential (I) for WT and Tau neurons with 24-hour AR treatment. Box plots display the median, interquartile range, and whiskers extending to values within the interquartile range multiplied by 1.5. Sample sizes for passive parameters: WT: 64, WT+AR: 13, Tg: 40, Tg+AR: 31. Significance determined by two-way ANOVA with Sidak’s multiple comparisons test (B) or one-way ANOVA with Tukey’s multiple comparisons test (F). Soma size and pJNK/JNK data shown as mean ± SEM. Significance determined by two-way ANOVA with Sidak’s multiple comparisons test or Student’s t-test with Welch’s correction). Significance was determined by Kruskal–Wallis and post-hoc Dunn’s tests. Significance is represented by horizontal brackets between groups (G-I) (* p<0.05, ** p<0.01, *** p<0.001, **** p<0.0001).

