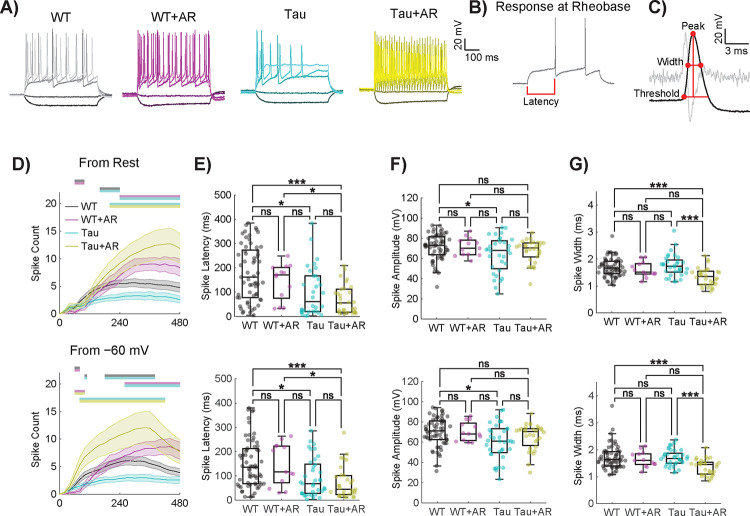
Figure 5. Active electrical properties are altered in Tau neurons and restored by AdipoRon.
A) Representative spiking patterns for WT and Tau neurons following 24-hour 10μM AR treatment in response to current applications of −100, −20, 160, 320, and 480 mV (darker to lighter shades). B) Voltage response at rheobase (minimum current required to fire an action potential) for a WT neuron. C) A zoomed version of the first spike fired at rheobase displayed in B. The second derivative is displayed in light gray. The max in the second derivative within a specified window (from when the first derivative was greater than 30 mV/ms to 3 ms prior) determined the threshold voltage for a spike to be fired. Computed rheobase parameters are displayed by the red dots and lines. D) Action potential spike counts were measured in response to 30 stepwise current applications of 20 pA from −100–480 pA for each cell from rest (top) and from −60 mV (bottom). Statistics were performed using repeated measures two-way ANOVA with Geisser–Greenhouse correction and post-hoc Tukey tests. Locations of significantly different comparisons are color-coded by bars at the top. Error bars are SEM. E–G) Spike latency (E), amplitude (F), and width (G) for the first spike fired at rheobase were similarly collected from current-clamp protocols performed for each cell from rest (left) and from −60 mV (right). Spike width was measured using the full width at half amplitude. Box plots display the median, interquartile range, and whiskers extending to values within the interquartile range multiplied by 1.5. Statistics were performed using Kruskal–Wallis and post-hoc Dunn’s tests. Significance is represented by horizontal bars between groups. Sample sizes for D–F are WT: 63, WT+AR: 13, Tg: 37, Tg+AR: 31. (* p<0.05, ** p<0.01, *** p<0.001, **** p<0.0001).

