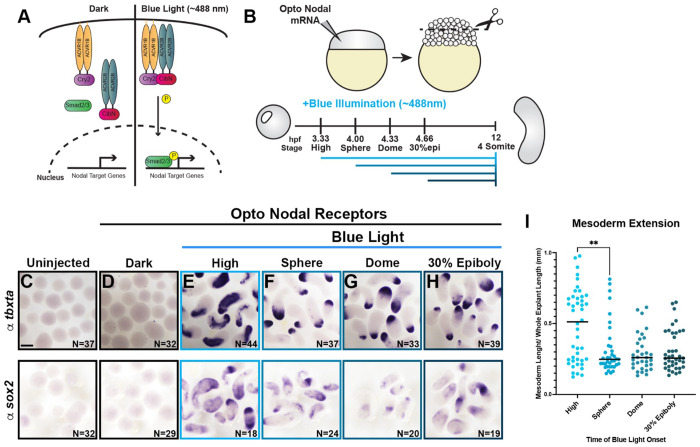
Figure 3: Timing of Nodal signaling onset is sufficient to determine tissue-specific C&E in explants.
A) Diagram of optogenetic Nodal (opto-Nodal) receptors. B) Overview of opto-Nodal onset experiments in explants. C-H) Representative images of WISH staining for the mesoderm and NE markers tbxta (top) and sox2 (bottom) in explants exposed to blue light at the stages indicated and analyzed at the equivalent of 4-somite stage. N = number of explants examined per probe and condition from 6 independent trials. Scale bar = 200 μm. I) Mesoderm extension within explants (shown in (E-H)) as described in Figure 1. Black bars are median values, **p=0.0053, Mann-Whitney test.

