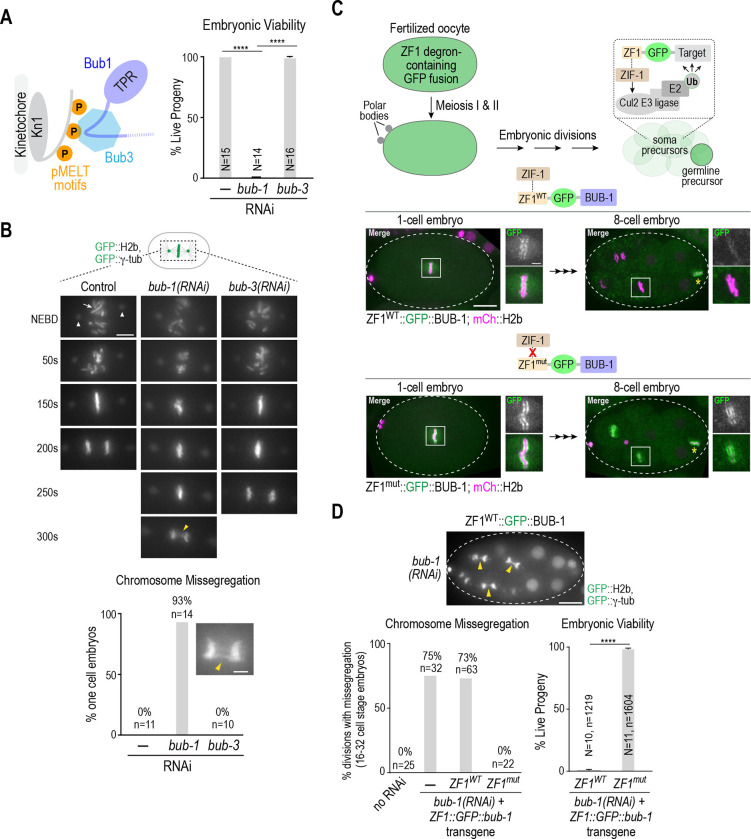
Figure 1. The more severe chromosome segregation defect of BUB-1 depletion relative to BUB-3 depletion is independent of BUB-1 function in oocyte meiosis.
(A) (left) Current model for Bub1-Bub3 complex localization to kinetochores. (right) Embryo viability analysis for the indicated conditions. N is number of worms whose progeny were scored. Error bars are the 95% confidence interval. (B) (top) Stills from timelapse movies, aligned with NEBD, for the indicated conditions. Embryos imaged expressed GFP::H2b and GFP::γ-tubulin to visualize chromosomes (arrow) and spindle poles (arrowheads), respectively. Yellow arrowhead in the 300s bub-1(RNAi) panel highlights missegregation. Scale bar, 5 μm. (bottom) Quantification of chromosome missegregation in anaphase for the indicated conditions. Inset shows an example missegregation event. N is number of embryos imaged. Scale bar, 2 μm. (C) (top) Schematic describing the effect of ZF1 degron fusion to a target protein. The fusion is present during oocyte meiosis and in one-cell embryos but gets degraded specifically in soma precursor cells in a ZIF-1-dependent manner. (bottom) Images of ZF1WT and ZFmut GFP::BUB-1 fusions at 1-cell and 8-cell stages; the imaged embryos also expressed mCh::H2b to mark chromosomes. Dashed white line shows the embryo outline. White boxes indicate regions magnified on the right. Yellow asterisk marks the germline precursor cell. Scale bar, 10 μm (whole embryo images), and 2 μm (magnified regions). (D) (top) Image of GFP::H2b and GFP:: γ-tubulin in a ZF1WT::GFP::BUB-1 embryo following depletion of endogenous BUB-1. Arrowheads point to missegregating chromosomes in soma precursor cells. Graphs below plot chromosome missegregation (monitored at the 16–32 cell stage, left) and embryo viability (right). Error bars are the 95% confidence interval. In the viability analysis N is the number of worms and n the number of progeny embryos scored. All p values are from unpaired t tests; **** = p<0.0001.

