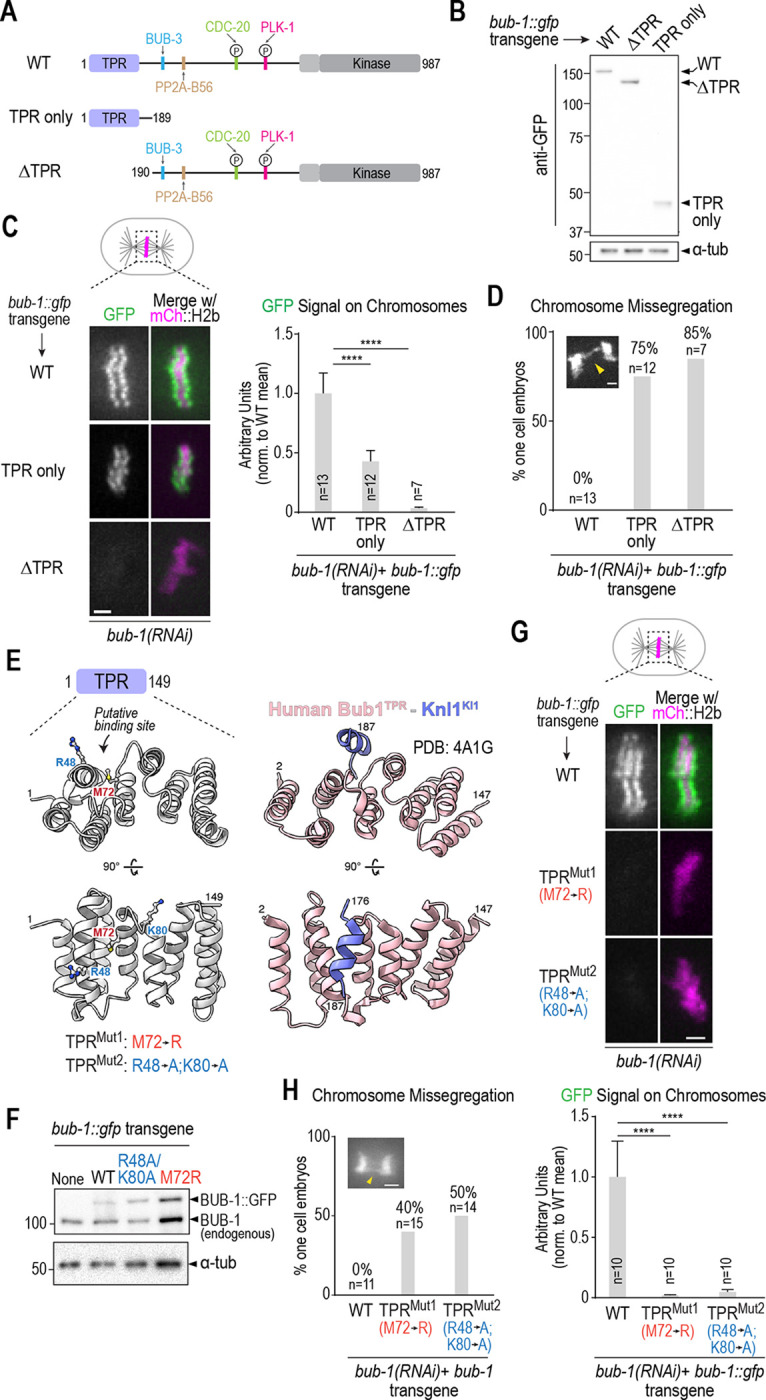
Figure 2: The BUB-1 TPR is necessary and sufficient for kinetochore localization.

(A) Schematic of wild-type BUB-1, highlighting key domains and interfaces, along with designed TPR only and ΔTPR variants. (B) Anti-GFP immunoblots of strains with the indicated integrated bub-1::gfp transgenes. Molecular weight markers are in kilodaltons. a-tubulin serves as a loading control. (C) (left) Images of aligned chromosomes in one-cell embryos from strains with the indicated bub-1::gfp transgenes; the strains also expressed mCh::H2b to mark chromosomes and endogenous BUB-1 was depleted. Scale bar, 2 μm. (right) Quantification of GFP signal on chromosomes for the indicated conditions. Error bars are the 95% confidence interval. n is the number of embryos imaged. (D) Quantification of chromosome missegregation in one-cell embryo anaphase for the indicated conditions. n is the number of embryos imaged. (E) Comparison of a structural model of the BUB-1 TPR and the human Bub1 TPR – Knl1 KI1 motif crystal structure (PDB:4A1G) (Krenn et al., 2012). Residues targeted for mutation in BUB-1 are highlighted below the en face view of the convex surface of the TPR. (F) Anti-BUB-1 immunoblots of strains with the indicated integrated bub-1::gfp transgenes. GFP-fused and endogenous BUB-1 are marked. α-tubulin serves as a loading control. (G) (top) Images of aligned chromosomes in one-cell embryos from strains with the indicated bub-1::gfp transgenes; the strains also expressed mCh::H2b to mark chromosomes and endogenous BUB-1 was depleted. Scale bar, 2 μm. (bottom) Quantification of GFP signal on chromosomes for the indicated conditions. n is the number of embryos imaged. Error bars are the 95% confidence interval. (H) Quantification of chromosome missegregation in one-cell embryos for the indicated conditions. n is the number of embryos imaged. Example missegregation image is the same as in Fig. 1B. All p values were calculated by unpaired t tests; **** = p<0.0001.
