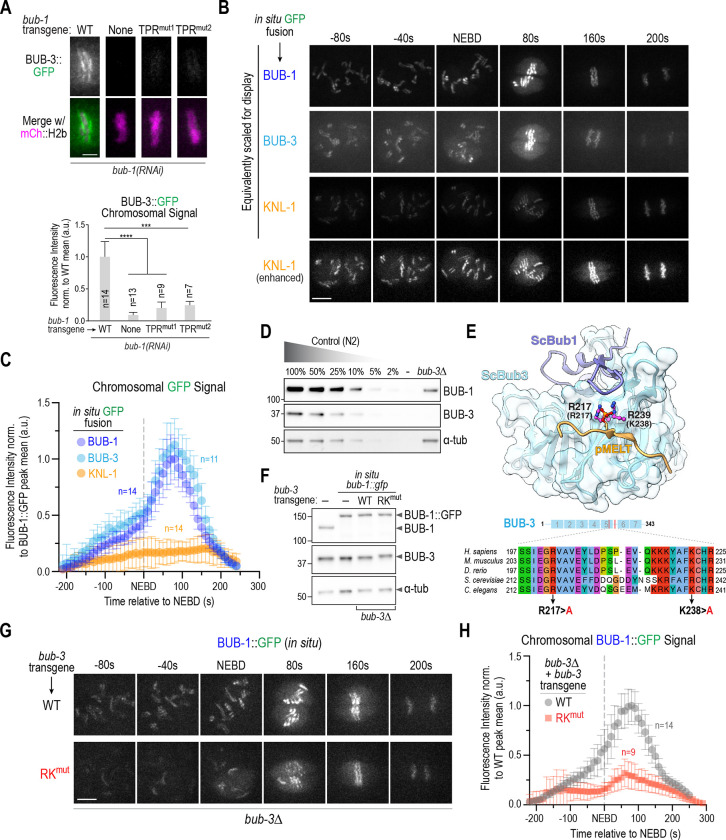
Figure 4. BUB-3 recognition of pMELT motifs drives the rapid increase in BUB-1–BUB-3 localization at kinetochores during mitotic entry.
(A) (top) Localization of BUB-3::GFP in the indicated conditions. Scale bar, 2 μm. (bottom) Quantification of BUB-3::GFP chromosomal signal. Error bars are the 95% confidence interval. (B) Images from timelapse sequences of the indicated in situ GFP fusions. Sequences were time-aligned using NEBD as a reference. All three strains also expressed mCh::H2b which was simultaneously imaged but is not shown. All imaging was conducted under identical conditions; the top 3 image rows are equivalently scaled for display to highlight the super-stoichiometric recruitment of BUB-1–BUB-3 complexes on KNL-1 scaffolds. The bottom row shows enhanced scaling of the KNL-1::GFP signal to display its robust and constant kinetochore localization. Scale bar, 5 μm. (C) Chromosome segmentation-based quantification of GFP signal over time for the indicated in situ GFP fusions. Chromosome segmentation was performed using the mCh::H2b signal (see Fig. S4A for details). Error bars are the 95% confidence interval. n is the number of embryos imaged. (D) Immunoblots of a dilution curve of control (N2) worm extract and a bub-3Δ worm extract using anti-BUB-1 and anti-BUB-3 antibodies. α-tubulin serves as a loading control. (E) (top) Structure of S. cerevisiae Bub1-Bub3 complex bound to a pMELT peptide from ScKnl1/Spc105 (PDB:4BL0;(Primorac et al., 2013)). Sidechains of the phosphorylated Thr in the MELT peptide and the two basic residues critical for binding the phosphopeptides (R217 and K239) are shown. Residue numbers in brackets below the R217 and K239 labels refer to the corresponding C. elegans BUB-3 residues. (bottom) Sequence alignment of the region of Bub3 that engages the pMELT peptide. The two basic residues mutated in BUB-3 to disrupt pMELT recognition are highlighted. (F) Immunoblots of the indicated conditions using anti-BUB-1 and anti-BUB-3 antibodies. α-tubulin serves as a loading control. (G) Images from timelapse sequences of in situ GFP-tagged BUB-1 in the presence of WT or RKmut BUB-3; the endogenous bub-3 gene was deleted. The strains also expressed mCh::H2b, which was simultaneously imaged but is not shown. Scale bar, 5 μm. (H) Chromosome segmentation-based quantification of BUB-1::GFP signal over time for the indicated conditions. n is the number of embryos imaged. Error bars are the 95% confidence interval. All p values are calculated from unpaired t tests; *** = p<0.001,**** = p<0.0001.

