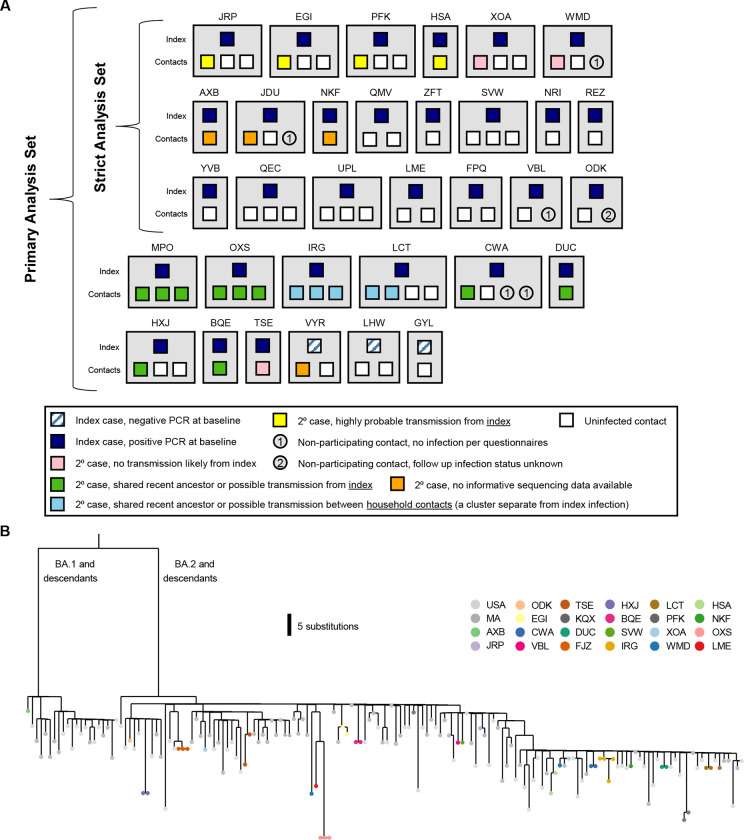
Figure 2. Household diagram.
(A) Individual households are labeled with a 3-letter identifier and represented with grey boxes. Households in both the primary and strict analysis sets are shown. Each member of the household is shown within the grey box, with their outcome color-coded as described in the legend. (B) Phylogenetic map of positive samples.

