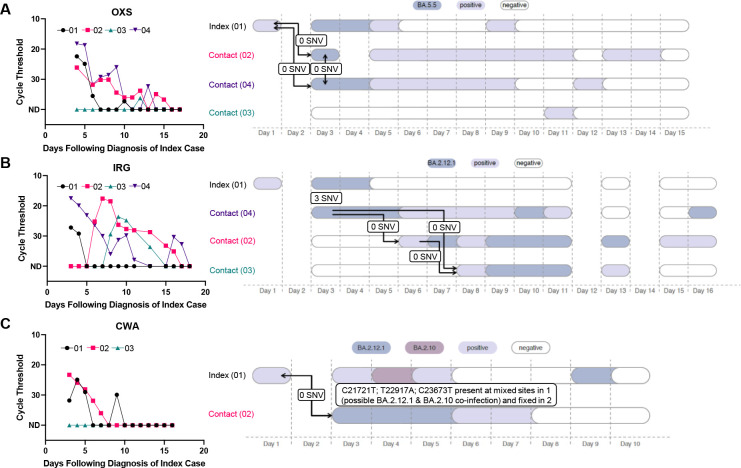
Figure 4. Representative viral load curves and transmission plots from primary analysis set.
(A) A representative household is shown where either a shared exposure (i.e., social network) exists or within-household transmission has occurred, as all cases are genetically linked to the index case. (B) A representative household is shown where two separate infection clusters were identified. (C) A household is shown where a putative co-infection was identified in the index case.

