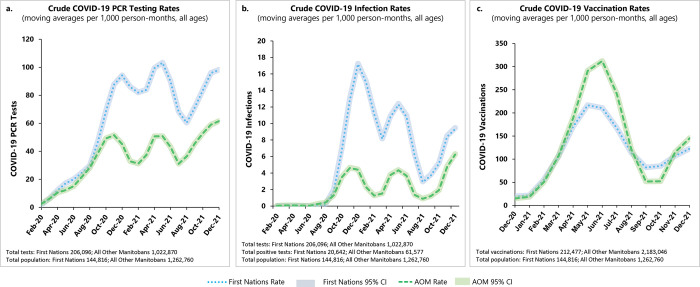
Fig 2. Crude monthly moving averages of COVID-19 infection, testing, and vaccination rates among Manitoba First Nations and AOM. February 2020 to December 2021.
Rates per 1,000 person-months with 95% confidence intervals. Note differences in axis scales in (a–c). AOM, All Other Manitobans; COVID-19, Coronavirus Disease 2019.

