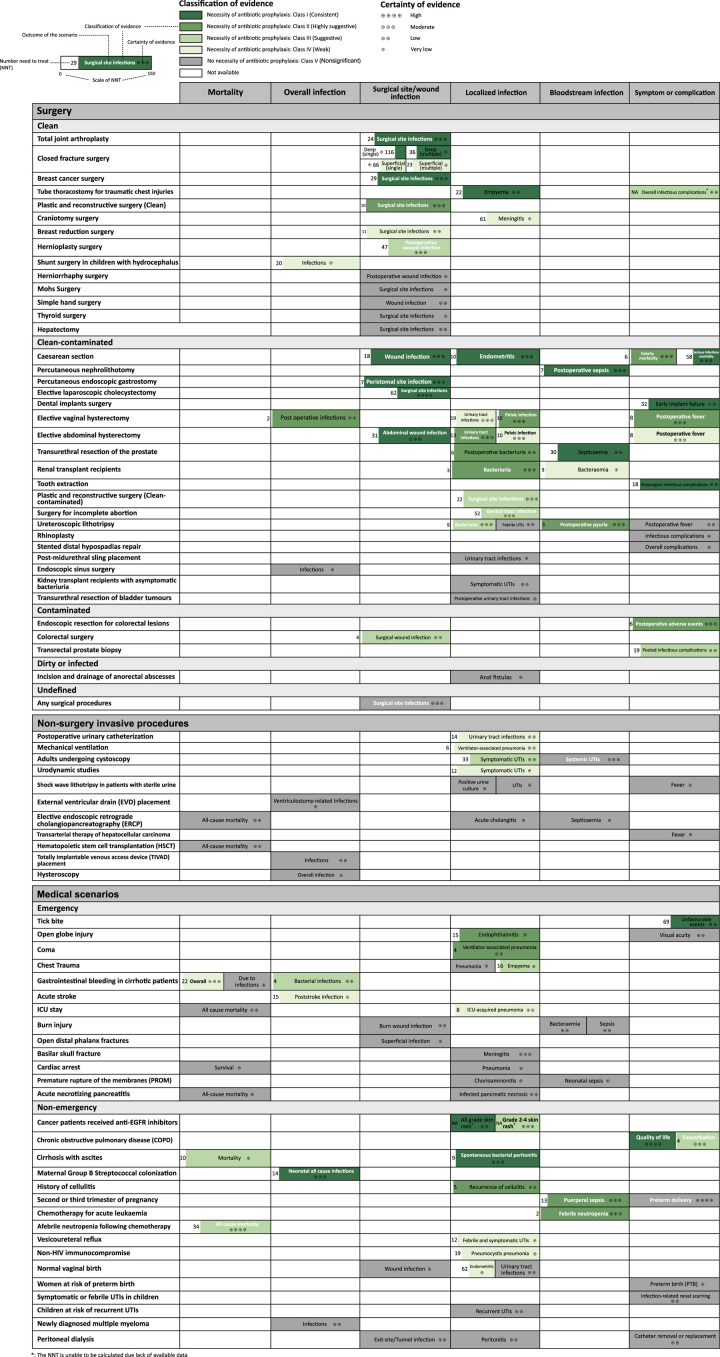
Figure 6.
Evidence map summarizing findings and certainty of evidence. The certainty of evidence was rated by the Grading of Recommendations Assessment, Development, and Evaluation criteria. The color of each block represents the classification of evidence and the filling fraction of color represent scale of number need to treat (range from 0 to 150 for all outcomes). *The NNT cannot be calculated because original data are unavailable.

