
FIGURE 1.
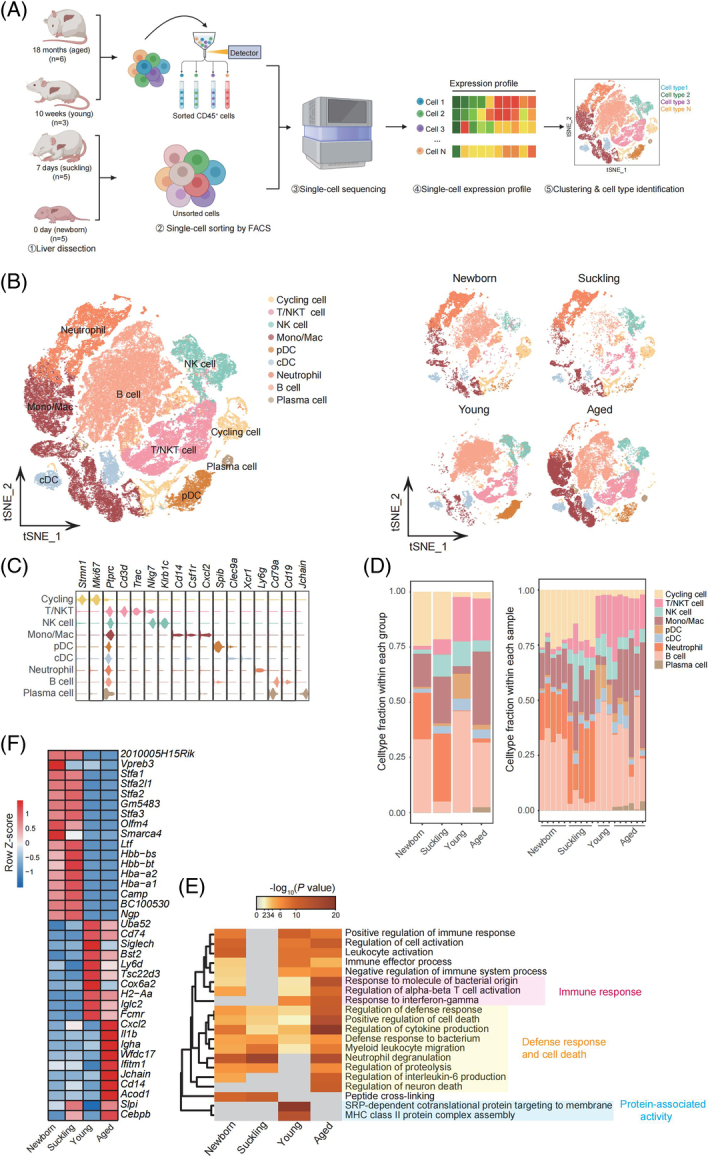
Mouse hepatic immune cell transcriptional atlas. (A) Experimental design for scRNA-seq analysis of intrahepatic cells from mice at four age stages. Newborn, n = 5; suckling, n = 5; young, n = 3; aged, n = 6 mice. (B) t-SNE plot of all hepatic immune cells from mice at 4 different ages showing 9 clusters (left). t-SNE plots showing the distribution of hepatic immune cells from mice in different age stages (right). (C) Violin plots showing the expression levels of representative cell type-specific marker genes for the corresponding cell types in the mouse liver. (D) Relative changes in the cell ratios of hepatic immune cells across the 4 age stages (newborn, suckling, young, and aged) (left) and individuals (right). (E) Representative GO BP terms and Reactome pathways enriched with upregulated genes in each age stage in comparison to the other 3 age stages. The top 5 terms for each age group based on the −log10 (p-value) are listed. The color scale from red to gray indicates p values from low to high. DEGs were identified based on the threshold |log2(fold_change)| ≥ 0.5 and adjusted p-value < 0.05. (F) Heatmap showing the expression signatures of the top 10 specifically expressed genes in hepatic immune cells in each age stage; the value for each gene is the row-scaled Z score. Abbreviations: cDC, conventional dendritic cells; GO BP, Gene Ontology Biological Process; Mono/Mac, monocyte and macrophage; pDC, plasmacytoid dendritic cells; scRNA-seq, single-cell RNA sequencing; t-SNE, t-distributed Stochastic Neighbor Embedding.